I'm going to use several ETFs to compare financials.
FAS Financial Bull 3X
5 mn chart shows the negative divergence off yesterday's open, as well as the accumulation of today's lows.
The 1 min chart showing accumulation of today's lows and what looks to be a pullback, maybe a consolidation getting ready to take place in financials.
FAZ Financial Bear 3X
Here yesterday you can see support for FAZ at the support trendline, if this trendline is broken, FAZ should fall fast.
FAZ 15 min shows to the far left a negative divergence and a head fake in the red box that made new high, then accumulation the second being at yesterday's open lower.
The 5 min chart shows accumulation into the gap lower opening lows yesterday and a current negative divergence.
The 1 min chart shows much the same, several negative divergences.
UYG Ultra Financials Long
The daily chart here is pretty strong and in a leading positive divergence.
Looking at the 1 min, it looks like FAS (Financial Bull 3x) in that there was accumulation of today's lows and it now looks ready for a consolidation or more likely a pullback.
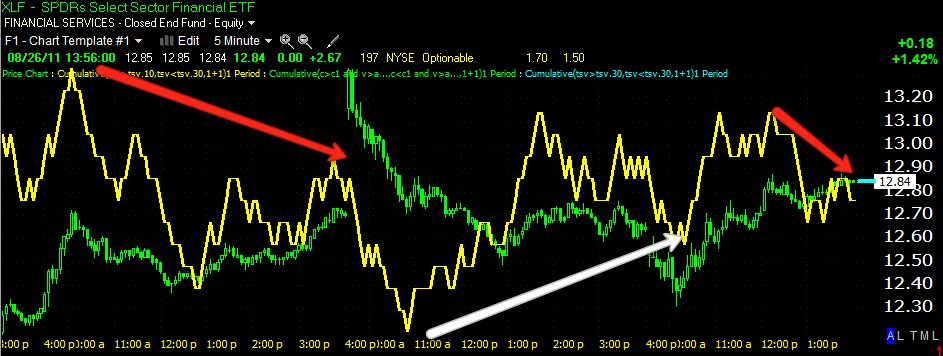
XLF Financials ETF
The 10 min chart shows yesterday's negative divergence on the gap up open and accumulation on the drop this morning.
The 5 min chart confirms all the others with a negative divergence on the gap up yesterday morning, accumulation of today's lows and a current negative divergence suggesting a pullback/consolidation.
The 1 min chart is consistent with all of the other charts, implying at least a consolidation if not a pullback.


 | Theme by Thur
No comments:
Post a Comment