There are many underlying indications that are not apparent by price alone that suggest we are working on a bottom, however we must remain balanced in viewing possible scenarios, such as the possibility of a French sovereign debt downgrade or simply the pessimistic sentiment, whether it be Europe, Asia or the US. We also face short term challenges such as today's nearly unprecedented quote stuffing which knocked the market down in late trade, so much so that the NASDAQ nearly had to reset during the trading day. This is the first time I've even heard this to be an issue.
As difficult as it is to say, based on the charts and many pieces of the puzzle, I retain a short term bullish bias and an intermediate and long term, very bearish bias. It may sound counter intuitive, but there are many different trends happening at the same time, whether it be a primary, intermediate, short term or ultrashort term trend, there can be a wide range of trends all at the same time. I sum this up as tactical vs strategic outlooks.
One chart I did want to share are the current pivot points for the S&P-500

Another interesting chart is this one, remember trend classification

Looking back at our short covering rally, we see the same, except in an uptrend

Breadth Charts


GLD
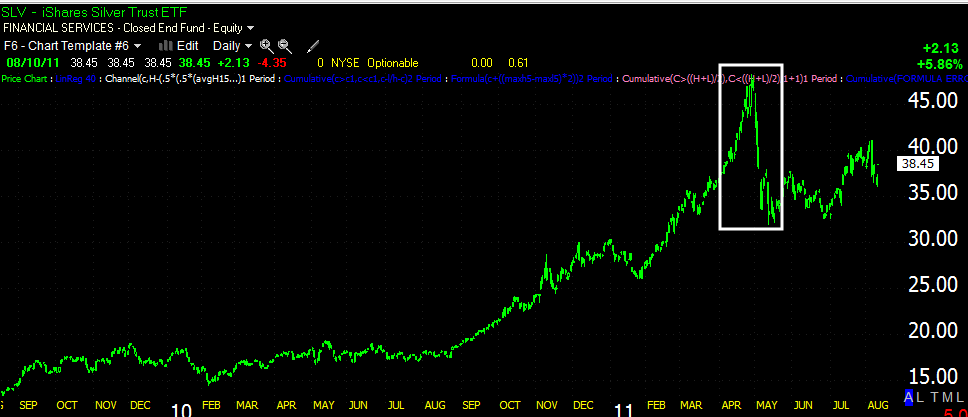
We know there have been some 3C warnings in GLD, today the CME hiked gold margins by 22%, a move gold shook off pretty quickly, but knee jerk reactions should be put in proper context and remember the last time the CME was intent on killing a PM, Silver, they hiked every other day for 5 or 6 consecutive hikes until they killed the silver rally. Do I believe the CME has people inside that may have leaked the impending action, OF COURSE! This action may be problematic for some hedge funds that aren't performing so well such as Paulson's, now they have to come up with extra liquidity for their gold trades at a time when liquidity is at a premium.
We must stay alert and ready to move, but also unafraid to look at and weight the information in the face of a scary market.


No comments:
Post a Comment