DIA 1 min negative divergence, suggests we will likely see prices back in the trading range today.
DIA 5 min negative divergence, but not severe.
DIA 10 min leading positive with a short term negative divergence today
DIA 15 min the same as above.
QQQ 1 min in line
QQQ 5 min in line, but within a negative divergence.
QQQ 10 min in line today, but within a longer leading positive divergence.
Same with the 15 min.
SPY 1 is a bit stronger then the other averages on the 1 min
as well as the 5 min in which today the leading positive divergence has gained more traction.
As has the 10 mn
And the 15 min
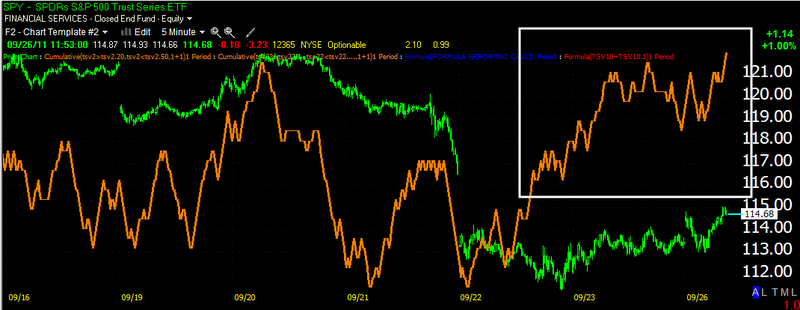
The 3C depth chart shows the early head fake was used to accumulate a bit today.
The longer view of the same chart as above. The first white box was 1 day of accumulation, the second was 2 days, we are now working on our 3rd day with a much shallower trough, meaning a stronger positive divergence
VXX-Volatility which trades the opposite or inversely to the market. The 1 min chart shows some damage today which is what I would expect to see in an ongoing round of accumulation in the market averages.
VXX 5 min is leading negative today, this is a good sign for the scenario I described in last night's post,
The Week Ahead. In other words, the confirmation I would expect to see among various assets and timeframes is playing out according to what I would expect.
VXX 10 min is negative today
VXX 15 min is leading negative and adding to that distribution today, remember, ths is showing signs of distribution implying volatility will decline and as it trades the opposite of the market, this is positive for equities as they reman in the accumulation zone.
VXX 30 min is starting to go leading negative as of today, this is a long term chart representing longer term trends, we haven't seen too many if any 30-60 min signals for 6-7 weeks, so the 3C depth chart which is showing very strong market accumulation is confirmed in the 30 min. longer term chart being negative here.
And look at the leading negative 60 min chart of VXX! Pretty amazing and as I suspected last week, it appears we are accumulating for what will likely be one of the biggest moves up we have seen in 6-7 weeks throughout the chop of the daily bear flag.
I do think that we have a good chance of heading lower in the market and in to the accumulation zone and as I stated last night, a head fake below the accumulation trading range or even a new low, while seemingly a ugly event for the market, is seen about 80% of the time before an upside reversal begins. In fact, such a move tends to be one of our best timing indications as the market generally reverses as soon as the head fake/shakeout/ and in this case, bear trap, is complete.


No comments:
Post a Comment