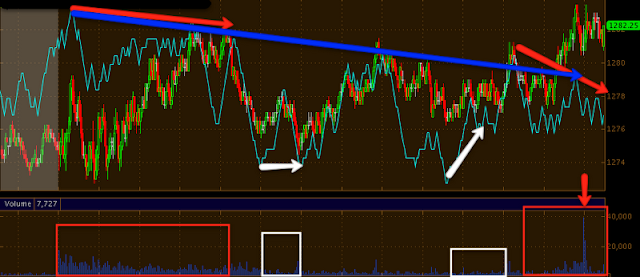
Here's today's ES (E-Mini) contracts. The average volume today was about 4700 contracts per minute and this is a 1 min timescale. There was a negative divergence in the morning that sent ES lower. Note the higher volume during the negative divergence which signifies distribution (3C can not tell the difference between selling distribution and short selling distribution as they both come across the tape as a sale-so it could have been either, but I would lean toward short selling in to strength). After that negative divergence sent pries lower, there was a positive divergence (accumulation/buying), however it was on a much smaller scale as volume reflects in the white box. This is an old market maker strategy but I assume bigger players use it as well, they buy the ask until they push price up, but on as little volume as possible and then sell on heavier volume in to the advance. There was a second accumulation period (white) again on lower volume followed by another intraday bounce, this time on heavier volume. This rally was in to 2 negative divergences, a long term one (blue arrow) and a local one (red arrow) and during this time period, we actually saw the heaviest volume of the day at 39,229 contracts in a single 1 min period (about 8x the average). The overall volume was rising as well.
Here is an example of follow through buying this week in URRE. The first day is the breakout (and this isn't even really important resistance), the second day sees follow through buying in which price and volume shoot up as investors judge this to be the start of a new leg or trend up.
Here's an example of a Harami Cross in Goldman Sachs, it's not exactly the same, but these are rare candle formations and difficult to find.
Here's the GS Harami Cross reversal, it is similar in a couple of ways, the two candles are very similar and GS broke an important resistance level. Here's what happened next...
The Cross is in the white box, GS fell about 45%. However, a Harami Cross reversal does not carry a downside target, it simply is a high probability reversal pattern.


No comments:
Post a Comment