When the market is in risk off cycles, investors put money in treasuries as a flight to safety, when they perceive equities will give them a higher rate of return, they sell Treasuries in the risk on trade.
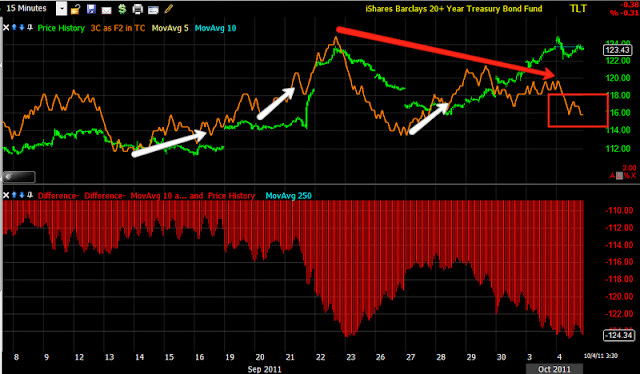
It looks like TLT is being sold.
Here's the inverse correlation between Treasuries and the S&P-500, T's in green, the S&P in red.
Here's the 1 min TLT chart
The 2 min
The very important 15 min which is leading negative
And a long trend 60 min chart.
Is interest rates about to start going up?
-
Yes, I know - it does not make any sense - FED is about to cut
rates...but....real world interest rates are not always what FED wants it
to be.
6 years ago


No comments:
Post a Comment