As I mentioned, "As the trend starts developing, we'll be moving away from directional trades and in to sector trades with financials being the first target", this is why you are starting to see more individual names rather then directional market trades.
This is a financial and looking bad...
First on a daily chart, KCG formed a positive divergence in MACD, as well as a bull flag with perfect volume, bit volume on the up days as well as big volume on the lows of the flag which was a reversal doji candle. A top formed and MACD/RSI has been negative throughout, there are two red trendlines of support, 1 broken, the second close.
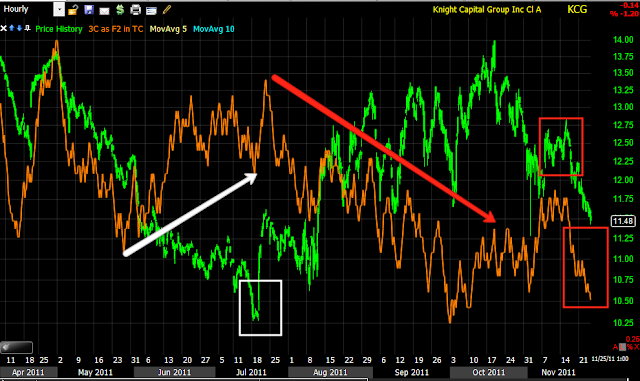
On an hourly chart, look at where the volume picked up, as support from a closing as well as gap.
The 3C hourly chart shows what MACD showed us, accumulation to start the move and then distribution throughout it, this entire move was used to sell KCG shares as distribution started almost immediately.
A 30 min chart shows more detail with the accumulation in white and distribution in red, note both highs at 1 and 2 were head fake breakouts marking the top and saw a vert fast move down, "From failed moves come fast moves".
The 30 min is leading negative.
On a 2 min chart, we see the last head fake move in yellow, short term accumulation and distribution in to new high as momentum chasers would have bought a breakout new high as Wall Street went short taking the other side of retail's long trade.
Here's my daily Trend Channel in a solid down trend, if at all possible, I would want to short any strength in the white box, but not above the trend channel. This is a position that I would consider entering in phases, maybe a little now, wait for the next and last support level to be hit, see if there's a bounce and add the rest on that bounce.
Keep this one on your watchlist.
Is interest rates about to start going up?
-
Yes, I know - it does not make any sense - FED is about to cut
rates...but....real world interest rates are not always what FED wants it
to be.
6 years ago


No comments:
Post a Comment