You may remember the article I posted about Natural Gas and the government (USGS/Army Corp. of Engineers) in a study released right around the time UNG cracked lower, found a connection between the wells that are used to extract Nat. Gas and earthquakes, this must have been a VERY long ongoing study and in my opinion is the sole reason that UNG has been under daily chart leading positive accumulation for some time. I believe the initial knee jerk reaction was "This is not good for Nat Gas" and sent UNG lower, but the larger view is, "This may restrict supply, which would send Nat Gas prices much higher". 3C seems to confirm this line of thought and as I often say, 3C shows us what smart money is doing under the price action, but we rarely know why until later, I think we found out why UNG has been under long term heavy accumulation. Here's an update and my argument for the above theory as well as some key levels in which UNG becomes attractive as a new or Add-To trade.
The top trendline break is about when the report was released, of course these are routinely leaked. Currently the lower trendline looks like an area that we may want to look at getting long nat gas whether through UNG or another entity.
On a shorter term intraday chart, I don't think this breaks out today, but this $8-ish level should be watched.
3 60 min went into a very positive leading divergence as support was broken. One thing I've noticed about long term bases, they almost always head fake/crack lower, right before they start their move up, this is in total contradiction to what Technical Analysis teaches and thus is a very good reason as to why it happens; shares can be accumulated en masse and on the cheap as the weak hands fold.
The 30 min chart shows the same intensifying leading positive divergence on the recent "U" shaped move lower.
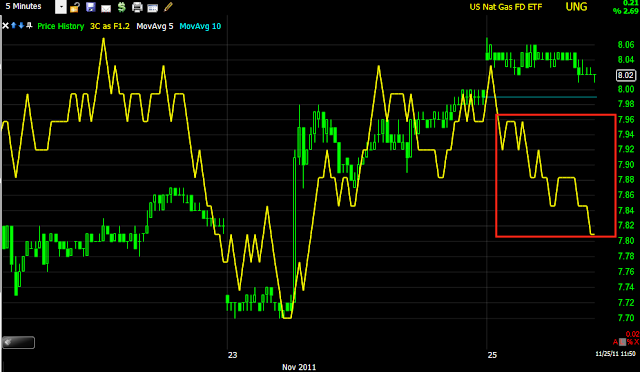
Here's today's intraday action and why I think it likely will not pop today, besides, the volume and trading day are too thin/short to attract momentum buyers that will flock to the stock once it breaks in to stage 2 markup, which will be represented by a move higher on surging green volume.
For me, any pullback into the white zone is probably a very low risk buy area, or a break above resistance at this $8-ish level, especially on heavy volume.
My crossover system on an intraday basis is now moving to a buy signal.
My Trend Channel has flattened out and a move above $8.15 changed the trend by two standard deviations.
Keep UNG on your radar.
Is interest rates about to start going up?
-
Yes, I know - it does not make any sense - FED is about to cut
rates...but....real world interest rates are not always what FED wants it
to be.
6 years ago


No comments:
Post a Comment