Too good to be true? The plain simple fact was that most people simply watched the S&P, Dow or NASDAQ and their moving averages and didn't bother to look any further in to the situation and simply assumed, "It's rally time".
Even a cursory glance at a few simple indications revealed major inconsistencies and likely major problems with the latest sugar high.
When the EU breaks good news and the US markets respond better then the EU itself, you must have a hint that something is not right.
Here we are as of the close and in to AH...
DIA 3C chart refused to relent on a worsening leading negative divergence the higher the DIA went, someone was selling lots of shares and shares short.
The amateurs trade the open, the pros trade the close, that doesn't speak well for the DIA-checkvollume and the extent of the snowball effect, I'll have to check if a technical buy level was hit that caused the snowball in to the EOD.
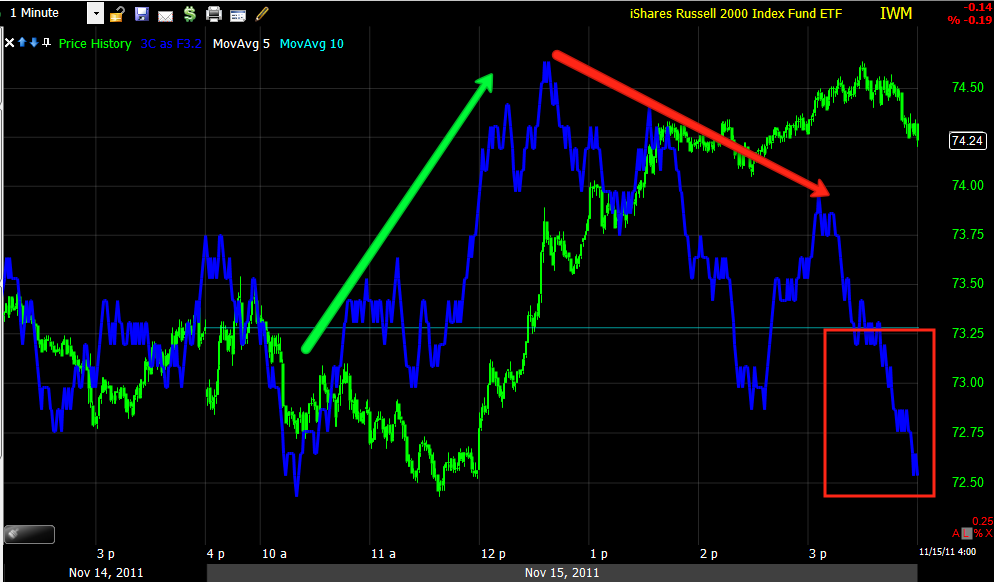
IWM nearly hitting new leading lows on the day as price hit new highs, that's a divergence anyone can see means trouble.
And the IWM into the close-the blue hash marks to the left of price is the AH bid / ask so the carnage continues in to AH trade.
The QQQ in a leading negative divergence and making consecutive new lows-
RED FLAG
THE Q'S retraced 1.5 hours of parabolic rally in 15 mins or so... FEAR IS STRONGER THEN GREED.
The SPY held out the longest on 3C, but ultimately the locals sold hard.
And look at that retracement, more then 2 hours of already parabolic rally reversed in 15 mnutes on heavy volume and it's still selling off in AH
TLT, the safety haven trade saw buying on volume and is even higher in AH.
As for ES, it happened fast, but when it happened, it went leading negative .
Here's the 4 p.m. close in red, ES continues to sell off and the volume thus far in AH, is bigger then the average volume through the day.
I had a feeling something was stinking.


No comments:
Post a Comment