So far this morning has started off very much like yesterday, if you recall early trading action formed a symmetrical triangle, which carries no inherent bullish/bearish bias, except that of the preceding trend, which was down, making this a downside consolidation/continuation pattern, except in today's case, at least initially, the triangle was much weaker.

Here's the DIA sym triangle this a.m., a general rule of thumb is triangles should have at least 5 points of contact, here you see 4 points of contact with the triangle's boundary and then a failure. Another rule of thumb, (these are true no matter if it is a small consolidation triangle or a large top) is that a triangle that breaks down when it is about 2/3rds of the way into the pattern, is much weaker then a triangle that breaks down at a completed apex or a finished triangle where the two trend lines meet, so this morning''s triangle not only did not see the false upside breakout like yesterday's, but also broke down early, implying a much weaker pattern then yesterday's.

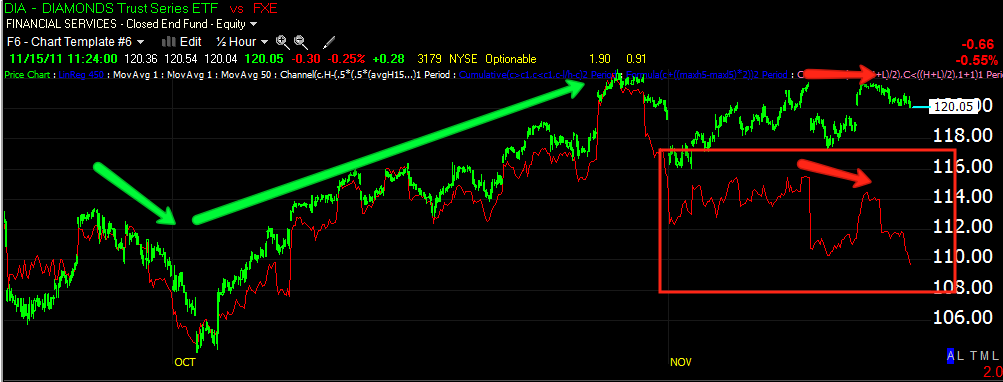
Here's the DIA vs FXE/Euro (red) and you can still see the Dow has some downside catching up to do to get back to the normal implied correlation between the currency and the equity price, earlier the correlation was good (in October) as you can see at the green arrows, now the Euro is significantly lower then the implied correlation for the Dow and the market as a whole.
DIA 1 min 3C chart shows early weakness in the triangle at the a.m. highs of the day as they were negatively divergent, currently 3C is in line with the price action, or confirming the price trend.
Here's the QQQ sym. triangle today, it did have enough points of contact, but the failure to make it to the top trendline (resistance) and a break before it hit that is also a classical sign of weakness.
The Q's are pretty much in line, there was a slight positive 1 min divergence on the open sending the Q's to the best level of the day thus far.
The SPY triangle had 4 points of contact and broke down very early in the attempt to make the 5th, if you see this on a daily chart on a major top, t implies extreme weakness. Volume also picked up in the SPY. You will notice I have a diagonal red arrow above volume on all of the triangle charts, this is the volume pattern you want to look for to distinguish a true triangle from random price movement.
SPY 1 min saw a negative divergence at the 10:45 highs, that was the last point of contact before the failure, currently trading in line as of these captures.
The 2 min showed a bigger problem much earlier on the highs of the day.
The 5 min is largely in line with the price trend (confirmation), but what is notable is the difference between yesterday as we had 5 min divergences that were positive and today in which we have none.


 | Theme by Thur
No comments:
Post a Comment