Today's market action seems VERY much like an Options Expiration "Pin". Yesterday I speculated n some levels for the market to close today as option contracts are pinned to cause the most contracts to expire worthless as professionals largely write the contracts and retail (amateurs) buy them. Pinning the market to a certain level ensures that the maximum number of contracts expire worthless, allowing the pros who wrote them to keep the premium profits. The levels I speculated for an OP-EX pin today where from $120 SPY to around $122 SPY, a much wider spread then usual, but there were some large outstanding positions or open interest at levels that would make a move to $122 worthwhile potentially.
Here's the most recent update and I am changing my template back over to the new Risk Asset/Credit template right now to see if there are any underlying changes in the credit, commodity , rates markets, etc.
As of this morning's open, the theme between 3C and the broader risk markets was nearly identical, some hints of very short term bullishness while the longer term trends are solidly implying a VERY bearish environment that should lead the market lower, by both the Credit market and 3C standards, which is a new form of confirmation to add to the many we already use.
DIA 1 min showed some late day positive divergences yesterday as the market flattened out, there have been some negative divergences since and a lot of confirmation (green arrows), currently there's a small negative leading divergence in the DIA 1 min chart.
The 5 min DIA shows in line status from late yesterday, and pretty much in line most of today, the fact there are no significant positive divergences seems to underpin the idea that the market may under the influence of an Op-Ex pin.
The 10 min chart shows some slight positive action.
The long term 60 min is very negative.
IWM 1 min showed a small positive divergence yesterday afternoon, followed by a negative divergence and we have had two recent consecutive, but small divergences, today, the first negative, the second positive, which also seems very mixed and no real underlying theme except that of a potential market pin.
The 5 min IWM showed a mild positive divergence near the close yesterday, and a small leading positive today, but thus far it has failed to capitalize on that divergence and has moved back to in line status at the green arrow.
The 10 min chart, other then showing the negative divergence that took the market down yesterday, is in line with no divergences to speak of today.
The longer term IWM 30 min chart is leading negative and near new lows, confirming credit and suggesting the emerging "forest" view, rather then the "trees" is quite negative for the market, despite any short term volatility.
QQQ 2 min shows the negative divergence causing the market to fall over the last several days, with a late day positive divergence yesterday, these positive divergences "may" just be enough support to keep the market from continuing to fall, given the option expiration today.
The 10 min QQQ chart also shows a modest 10 min positive divergence.
However once again, the long term trend is leading negative, the worst kind of divergence and has been for some time, the market has finally started to catch up to the underlying action 3C has been showing.
SPY 1 min shows a late day positive divergence yesterday and thus far today is trading nearly perfectly in line.
The 5 min chart showed the most robust of the 5 min positive divergences from yesterday, there hasn't been much of a price move, which lends some credibility to the theory that the positive divergences are just there to keep the market from falling much lower on an Op-Ex day.
The SPY 10 min is in line and flat, usually we'd expect to se some strength build in on the next longest timeframe, thus far none.
And the long term SPY 3C chart, hitting new leading negative lows.
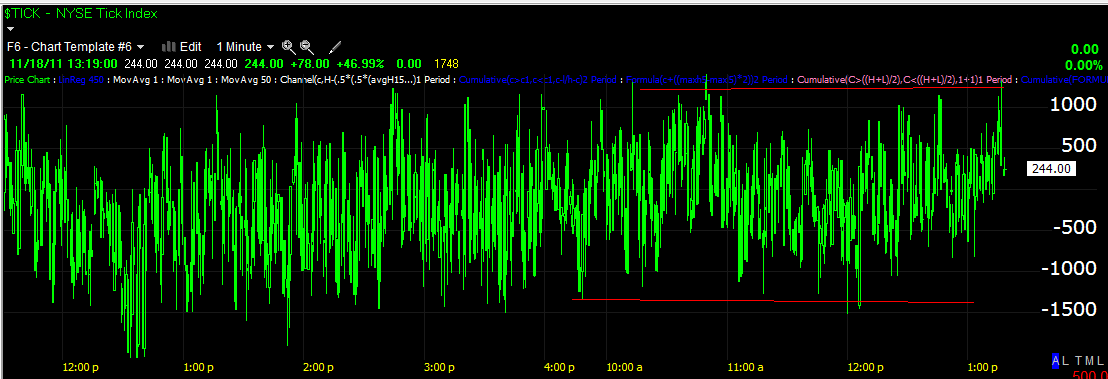
The TICK chart, which is very odd today, reflects a flat trend as many of the 3C charts above have shown, this is very rare to see in the NYSE TICK chart and again, I assume it is due to a potential market pin, neither letting the market fall or rise to pin it at a certain level to cause the options to expire worthless and put all the premiums in Wall Street's pocket.


No comments:
Post a Comment