Trade remains "unremarkable".
DIA 1 min showing some distribution in to the intraday bounce.
The 2 min chart with a couple of days of history showing yesterday afternoon's negative divergence mentioned and the current intraday bounce seeing some negative divergences as well.
The 5 min chart of the DIA with confirmation in the bear flag, which started on November 1st, the day before I warned of the likelihood of an upside reversal due to a doji candlestick close. The upside reversal formed a 3 day bear flag which broke down yesterday afternoon, you an see to the left when the bear flag started, some confirmation and the negative divergence through yesterday leading to today's move lower, which is completely unremarkable today as the 5 min chart is leading negative and not even showing confirmation on a relative basis, just heading down within the red box.
QQQ 1 min intraday bounce is in confirmation.
Here's the QQQ 2 min showing yesterday's negative divergence leading to the gap lower today and nothing remarkable about today's trade at all, no positive divergences before the bounce, just confirmation of the price move.
The 5 min QQQ chart is slightly more negative showing a negative divergence recently around 12:30 pm.
SPY 1 min shows confirmation on the intraday bounce as far as 3C is concerned, already showed you how it is lagging FX correlations, then a negative divergence around 12:30 as well.
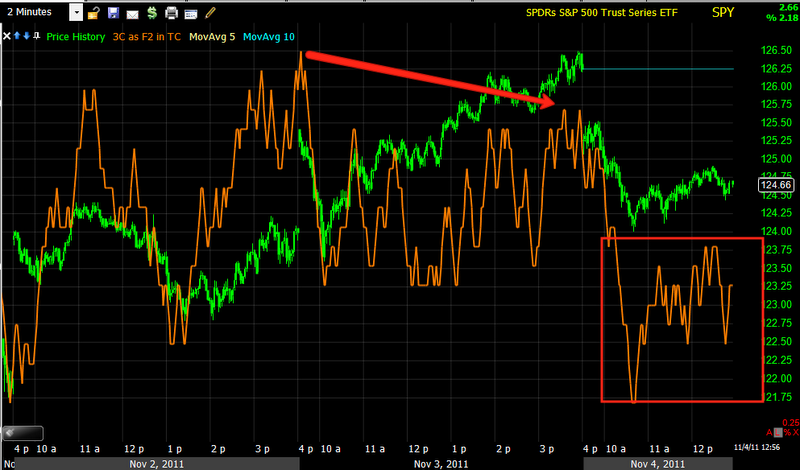
SPY 2 min chart with yesterday's negative divergence and a pretty decent entry point and today's leading negative divergence to the downside.
The same is seen in the 5 min chart, I should point out the negative divergence of Oct. 28th, as opposed to yesterday's, quite similar in the divergence and effect thus far.


 | Theme by Thur
No comments:
Post a Comment