We saw earlier commodities as a group were losing momentum today. I consider Energy, Financials and Tech to be probably the 3 most important industry groups.
USO as we saw earlier has hit a speed bump today. The larger Energy sector represented by XLE is also at a loss and gave up some nice earlier gains from the a.m.
Remember my earlier Linear Regression post and I said I expected USO to test resistance at $38.75-there it is to the cent, which also is now gap resistance.
USO's 15 min 3C chart shows the recent bounce to have occurred while 3C was leading negative and moving lower through the bounce.
Here's a close up of the 15 min chart on recent trade.
And the hourly chart, well this is the reason I decided to hold my oil shorts and let the dust settle.
As far as financials, we have seen the risk Financial momentum indicator and how it is dislocated from the broad bounce, but how about XLF?
A kiss the top good bye bounce... Today also displays thus far a candlestick Harami reversal pattern.
The 2 min chart couldn't confirm and went the other direction in a negative divergence.
The 5 min chart continues to lead lower, which should drag XLF down with it.
The 15 min chart speaks for itself.
Now we have XLK (Technology) which has been the only of the 3 performing today.
The 1 min chart made no effort to confirm which leads me to believe (since we have seen the same thing everywhere) that this bounce has been used to sell short for the most part.
A close up of the 1 min chart for the last 2 days shows today weakening despite the move higher.
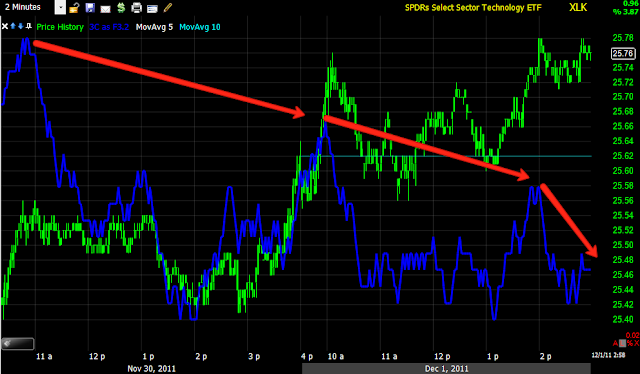
The 2 min chart looks similar, it only needs about 30 minutes to confirm price, it has had the week and hasn't done so, instead moving down.
Here's the close up of the 2 min, note the 3C weakness today in Tech.
Same with the 5 min chart,
And the 15 min chart, that's as clear of a divergence as you get.
A close up of XLK 15 min looks like its near topping. If I wanted to add tech shorts like TYP, I'd be doing it today.
The hourly overall is leading to new lows below the October lows.
And what is driving tech today, my guess is the most weighted stock in Tech, AAPL.
First today's price action is a wedge, a bearish one and confirmed by volume.
The 1 min chart, moving opposite to price in a leading negative divergence.
A close up of the 1 min shows continued 3C deterioration in to the wedge apex.
AAPL may in fact be a decent short here.
The 2 min close up is showing the same distribution in to a bearish price pattern.
The 5 min chart is divergence in several ways.
And long term, the 60 min chart is also at or recently at new leading negative lows below the Oct. lows.
So Tech looks to be the last leg on the table and it appears to be deteriorating pretty quickly.
I think we may have time to add tomorrow, but I have no problem adding today.
Is interest rates about to start going up?
-
Yes, I know - it does not make any sense - FED is about to cut
rates...but....real world interest rates are not always what FED wants it
to be.
6 years ago


No comments:
Post a Comment