Recently I said we'd be moving back toward stock picking and recently I also said that Technology is starting to look like a candidate and within technology, for the reasons I gave which include R&D funding, I'd be specifically looking at Biotechnology. Well, here it is, JAZZ and I like this one!
It would be difficult to fit a linear regression channel to this one, but the change is price character should be very obvious as recent lateral volatility has exploded, the easy money of trend following is over and it looks like we are at the end of stage 3 distribution, stage 4 decline is next.
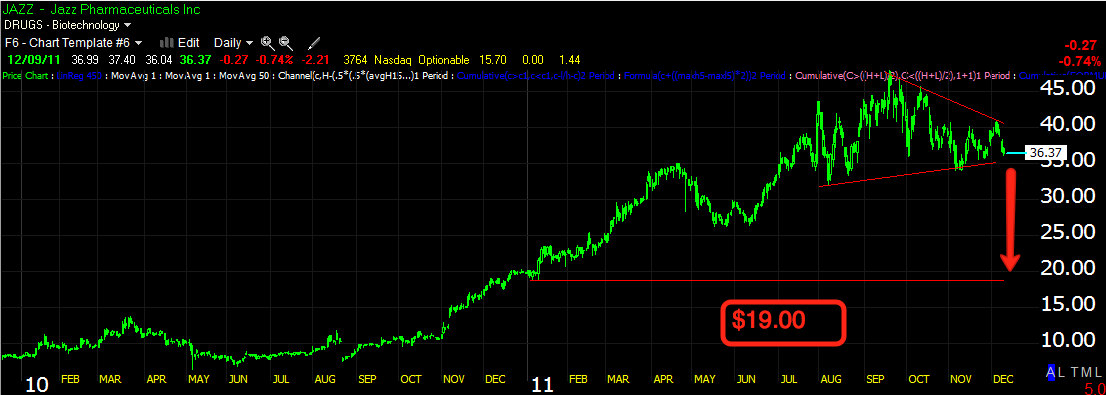
There are a few different options for a top here, I have gone with a triangle, but a case could be made for a slanting H&S top as well, either way, price volatility has exploded and JAZZ is no longer trending, a clear sign that something looks very ready to change.
Working from the Macro to the micro, the daily 3C chart shows accumulation in late 2008 and a decent amount, it seems that after the accumulation period, there was a very healthy mark up period and distribution of what appears to be a large accumulated position seems to have begun in early 2011, it has only gotten worse since then.
The hourly chart provides more detail as to how much worse it has become and this is without a doubt one of the ugliest hourly leading negative divergences I have seen, almost all taking place in the top area.
More recently the 15 min chart is also leading negative as every parabolic price move up has seen heavy distribution and then a massive failure.

Recent activity on the 5 min chart shows one of those cycles mentioned above with some accumulation, a parabolic/gappy move up and leading negative divergence at the top of the move. All of this recent trading action is very negative and makes sense as to why the longer term charts look so bad.
As for the Trend Channel, it has held two separate up trends very well and shows where each has ended at the red trendline with a close below that, so as of now, the Trend Channel is saying the uptrend is over.
I'm using a longer version of my crossover screen as this is a volatile stock and I want to reduce noise and reveal the trend, you can see the long signal in white and there hasn't been a signal confirmed sell signal until recently. RSI, one of the components of my Xover screen is also showing a negative divergence (RSI is one of the few contemporary technical indicators that I like, but not for oversold/overbought, but as a divergence indicator).
The bottom line is the price pattern gives us an implied downside target which happens to be $19, however if this reverses trend and really falls apart, these targets are almost always overshot to the downside, remember, with the market, the pendulum almost always swings way too far one way and then way too far the other and this is a perfect stock for that analogy.
All of that being said, it is very volatile and would probably require a fairly wide stop on the initial entry, or you can look for a high probability entry on a bounce or break below the triangle. IF you are interested in the trade and have questions or want to get a second opinion, feel free to email me.


No comments:
Post a Comment