Here we have a VERY wedgie (bearish) price pattern, there was a breakout from the wedge which would appear to be a headfake move. The day in yellow set a all time new intraday high on about 45% more volume then the 22 day average (I used a shorter average volume because volume has been falling and it is more in tune with recent volume action). AAPL could not hold that new high and closed below the all time closing high as of that day; that would indicate some churning was going on that day. Of course there was no follow through and as I have stated several times, AAPL looks like it's been pushed up on a short squeeze, which means there wouldn't be any underlying institutional support for prices at this level.
The 1 min hart has generally shown confirmation up and down, it's actually a bit leading negative when comparing relative price levels.
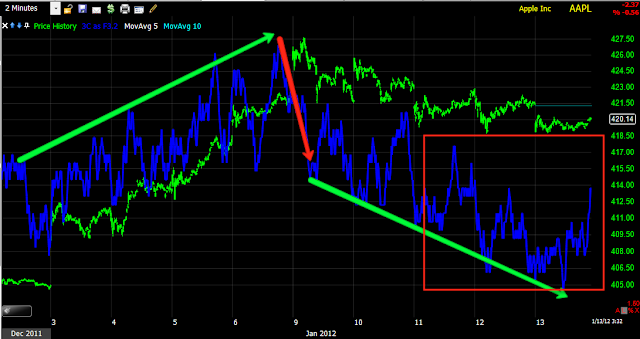
The same is true of the 2 min chart, I've marked the leading component in red here.
15 min goes from upside confirmation to a sharp negative divergence at the new high attempt, even with the recent 3C bump, it's still in a leading negative position.
The hourly chart is quite clear.
The daily 3C chart above and the daily MoneyStream chart below need no explanation.
Is interest rates about to start going up?
-
Yes, I know - it does not make any sense - FED is about to cut
rates...but....real world interest rates are not always what FED wants it
to be.
6 years ago


No comments:
Post a Comment