AAPL is probably the most important stock in recent market history, both as an innovator, a market bellwether and for its weight and ability to manipulate the market.
While you have to pay $10,000 to get NASDAQ's proprietary weighting schedule for each component on the NASDAQ 100, it was pretty well known before the NASDAQ revised their weighting several months ago that AAPL was not only the 1 component with the heaviest weight of probably any stock in any average, but it was around 20%. I had done a lot of research on this because I knew if you want to move the NASDAQ, you just need to move AAPL. AAPL had about the same weight as the bottom 50 weighted components combined! So theoretically, if we took the bottom 50 weighted stock and added AAPL and called it the NASDAQ 51, all 50 of the 51 stocks less AAPL could post a loss of 2% on the day and if AAPL posted a gain of 3% on the day, out theoretical NASDAQ 51 would close in the green by +1% even though 50 of 51 stocks closed down and only 1 closed up. This example is a bit of hyperbole, but it demonstrates how powerful AAPL is in moving the best performing average of late, the NASDAQ 100.
You may recall yesterday I addressed modern Dow Theory and showed you with a custom indicator I threw together the divergence between the major market averages and the NASDAQ 100, this is a violation of Dow Theory's confirmation and throws the entire market in to a suspicious light. So AAPL is the fulcrum upon not only the NASDAQ lays upon, but through Dow Theory, at this point the entire market!
That's why today action in AAPL is worth taking note of.
First though I wanted to give you the link to my article showing why AAPL is most likely NOT being accumulated by smart money and why their last BLOWOUT quarter may actually be a negative that causes hedge funds to dump AAPL (they certainly have had the chance to do so in to strength recently).
Next, AAPL is under pressure today because of talk that the NASDAQ will be rebalanced, the last time the NASDAQ rebalanced the market saw some heavy volatility and moved down 7%, which in comparison to recent percentage gains, would be huge.
Here's the link to the February 2nd article on AAPL.
Now for the charts...
AAPL's daily candle alone suggests heavy churning (the dumping of shares from strong hands to weak hands), volume would further confirm churning as this is will likely close at the highest volume in over a year.
As usual, the retail traders put their stops where they always put them, at the 5 min 50-bar moving average and volume swelled as that was broken today. Also note the RSI negative divergence in to the highs.
On a swing Trend Channel basis, the channel has held the entire move since late January without a single stop, that is until today.
The daily 3C chart seemed to be showing a top at the end of the October rally, it has been the rally that has taken shape since then that I consider to be the bear market rally, it is the area/dates in red. AAPL is showing significantly less money flow now at these highs then back in July or August and overall is in a large relative negative divergence, which has caused it to be in a leading negative position.
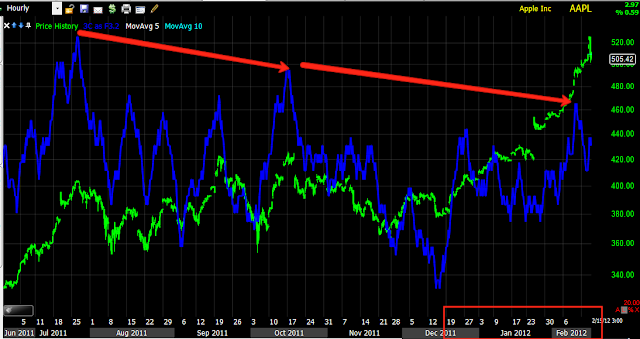
The hourly chart is negative as well. AAPL never puled back once since earnings and the gap up came on after hours trade post earnings, I can virtually guarantee smart money was not chasing AAPL up 14% (it opened the next day at about half that) in extended trading with poor liquidity. For smart money to accumulate AAPL, they'd realistically have to pull it back and accumulate on weaker prices. Smart money doesn't chase, retail does.
A zoomed hourly chart shows confirmation, even though the larger picture is that it is still leading negative, today's negative divergence went so far as to hit the hourly chart, something that is hard to do in a single day.
The 30 min chart was leading negative a week ago, so this rumor of rebalancing was likely already known by Wall Street , the 30 min went negative today as well, that is why it can be seen on the 60 min, it bled through on 30 min 3C weakness.
Here the 5 min chart has been negative locally as well, giving weight to the leading negative divergence on the 30 min chart mentioned above.
Intraday, distribution started well before the top-smart money HAS to sell in to demand with the size of their positions.
The bottom line, read the Feb. 2nd article I wrote on AAPL and why their earnings were more likely to produce a "sell the news event" and realize that smart money must sell into strength, just like the earlier example I mentioned when Crude hit it's highs and Cramer was creating demand for GS to sell/short in to.
It is very likely that Wall Street has known about an AAPL/NASDAQ rebalancing a lot longer then we realize.
The effect on the QQQ:
A bearish Engulfing Pattern
Is interest rates about to start going up?
-
Yes, I know - it does not make any sense - FED is about to cut
rates...but....real world interest rates are not always what FED wants it
to be.
6 years ago


No comments:
Post a Comment