I suppose this kind of market action would not be what you would expect to see upon reading headlines that "Greece got its bailout", which if you read the 3 page statement alone you would see it was clearly filled with holes and escape clauses with plenty of ambiguity. Or the kind of market action you'd expect from headlines flashing, "Dow 13,000!", but remember it is the market's job to make the most amount of people wrong at any one time and while the market action today I think speaks volumes, regardless of the percentage move, it's no time to take victory laps, but I do think it is a signal that 3C has been pointing out, breadth, Credit and risk indicators as well as numerous other indications that all suggest this is not the bull market rally most think it to be, rather more likely a very impressive bull trap or bear market rally, that has been my position and I haven't wavered from it. I don't come to these conclusions because of an opinion, they are the sum of observable facts if you look at indications other then price alone and in the end, this may indeed be a very dangerous market as I have often compared it to picking up spare change in front of a steam roller. In any case, like I said, this isn't a victory lap by any means, I don't see us there yet, but it is certainly a day of trade that would suggest the underlying action in the market has been correct in showing a dangerous bear market rally. We'll have to let it play out, but at the same time, take advantage of whatever opportunities we come across, long or short.
As for the update...
The market is clearly more bearish then the Euro, but we have seen these divergences many times, the most important is the long term below...
The Euro is deeply dislocated from the market correlation, I don't think this is because the correlation is broken, I think there will be a reversion to the Euro, I believe it is because the market has been in bear market rally mode.
Late day sector rotation is showing subtle changes, financials look to be cresting and starting to rotate out (keep in mind this is relative to the S&P performance), safe haven sectors like Utilities, Health care and Staples are rotating in, Basic Materials, Industrials look like they have crested and Tech is already in decline with Discretionary.
The DIA is now negative on the day, a mini fall from grace.
Here are the negative divergences as the Dow tried to break 13k and hold it, thus far the 5 min chart is in line with price action.
The 15 min chart was also negative at the try for 13k, this is a more significant divergence and while I would think a close above 13k would trap the most longs, so far it seems the intraday move has done its job, of course as I said earlier, this has not played out to the point in which I would say the reversal is upon us, but it doesn't look good either.

As a reminder of why I have felt we are seeing a dangerous bear market rally, the 30 min DIA chart says a lot, other charts such as credit and breadth as well as other indicators have been in agreement. If this is accurate and I have no reason to doubt it, it is one of the most dangerous looking divergences I have seen.
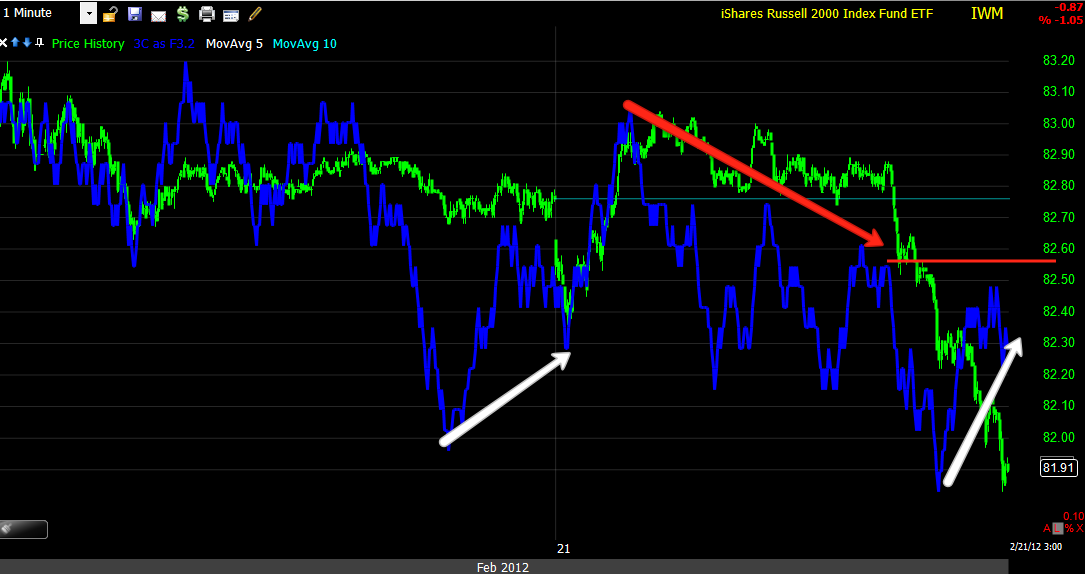
The IWM should lead all risk rallies, it is leading to the downside.
There is a slight positive or possible positive divergence on the 1 min chart, it is not on the 2 min chart and hasn't made a higher high so it may just be that I captured this screen shot at a time before 3C started moving down again.
The 5 min chart, as I warned last Friday and again today, looks the same as Thursday the 9th before the market fell the next day, except worse because 3C is leading deeper at this point.
The QQQ intraday
Again, the sme warning as mentioned above, except again 3C is deeper in to a leading negative divergence making this divergence worse then Thursday the 9th.
The 15 min chart is usually influential enough to cause a change in trend, except when we are deling with a larger distribution period, it looks very bad.
And the macro picture represented by the hourly chart is one of many reasons I have held to the view that this is a bear market rally. If so, when looking back at this period several years from now, it will be clear as a bear market rally, but appear as a blip on the chart, not at all like the emotional experience of going through it, which is why I encourage you to try to view historical charts in an emotional manner, in the end, a price chart is simply an expression of human fear and greed as well as Wall Street manipulations that have occurred since they started trading stocks on the actual wall on Wall Street.
The SPY intraday, all of these charts have fallen on the rejection of 13k in the Dow and probably on the realization of what the truth of the Greek Bailout announcement truly amounts to.
The 5 min chart is so far in line.
There is a hint of a 1 min. positive divergence, it is not on the 2 min chart, and thus not strong if in fact it is a positive divergence as it has not made a higher high yet.
SPY 2 min chart, with no positive divergence, although I would not be surprised to see a late day bounce to keep the "Buy the dip crowd" in the game on what appears to be a slight move down in price.
Remember the earlier post of Financial weakness or underperformance, here's the negative 5 min chart
The longer term 15 min chart
And the 60 min chart... These spell out bad news for this trend since late December.


No comments:
Post a Comment