This update is a little more detailed and a little more complicated then usual, but we are at an important crossroads so I'll do my best to make it clear.
DIA 1 min is the closest to in line out of all the averages and timeframes, there was a negative divergence on the open sending DIA lower this morning and then a positive divergence (remember the 1 min is pretty much intraday moves) sending DIA higher, right now it i in a relative negative diverence here.
The 2 min chart is still intraday moves, but more influential. You can see where we saw the positive divergence on the expected bounce and yesterday's strange negative divergence around 12-1 p.m. in all of the averages, it created a leading negative environment for the DI which it remains in with a small negative divergence now (or at the time of capture 10 mins ago or so).
The 5 min chart is more influential and excellent for this kind of bounce we were expecting (as of last Friday and Sunday's analysis). The positive divergence is clear, however yesterday's odd negative divergence again around the 12-1 p.m. timeframe is also clear. This chart is actually leading negative as we have higher prices today, but 3C hasn't made a higher high and remains below yesterday's highs.
A closer zoomed in view of the DIA 5 min shows a negative divergence on the open sending the DIA lower and a very small positive divergence (white) at the a.m. lows. Right now, We have several negative divergences, not only the larger leading negative seen above, but also a smaller one recently.
The bottom line is that there are negative divergences in to the bounce, which is what I want to see.
This is the ES chart below (E-mini S&P Futures)
At the pre-market highs reached in ES overnight, there was a quite large negative divergence, it is actually leading negative. We saw a positive divergence at the a.m. lows after ES declined more then 8 points from the negative divergence at the pre-market highs, that's a big fall in ES for a short period of time. The bounce of the morning positive divergence is now going leading negative.
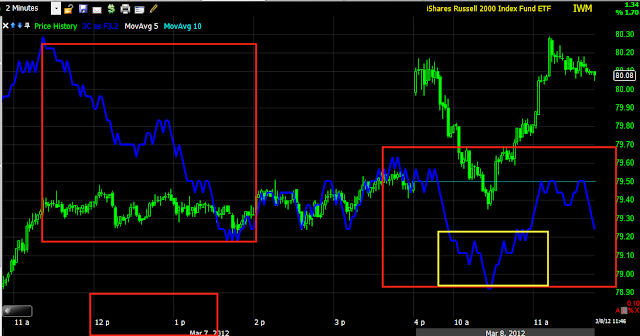
IWM 1 min showing the positive divergence to the left that started the bounce, again the unusual negative divergence yesterday around 1 p.m. which has kept the IEM in a leading negative position as prices are higher this morning then yesterday, but 3C is still below yesterday's high.
This is a close up zoomed vie of the IWM 1 min chart, you can see a negative divergence on the open sending the IWM lower, there was NO positive divergence at the a.m. lows today, so the IWM seems to just be floating with the market. The green arrows indicate an in line move (however remember this is within a larger leading negative divergence), this is where it is difficult to understand, but just remember the 1 min chart is intraday moves. As of the capture, there was a slight leading negative divergence building, this can represent a consolidation or a pullback.
IWM 2 min shows the bounce as all the charts do and yesterday's strange 1 p.m. negative divergence. Note the IWM is in leading negative position with a divergence at the highs of today.
A closer look at the IWM 2 min chart shows yesterday's strange negative divergence and the leading negative position the IWM remains in, again at the bottom this a.m., there was NO positive divergence.
IWM 5 min with the positive divergence for the bounce at the left, the negative at 1 pm area and a continued leading negative posture with a negative divergence on the open today, still no positive divergence today at the lows.
QQQ 1 min showing the divergences for the bounce up, yesterday's 1 p.m. -ish negative and a stronger negative divergence currently
The 2 min chart has remained leading negative, even since the bounce started.
A closer look at the QQQ 2 min
QQQ 5 min shows the strongest negative leading divergences at yesterday's 1 p.m. area and continuing in to today as 3C refuses to make a higher high.
A bigger picture of the 15 min QQQ chart, since the top, the Q's have remained leading negative, showing no real positive underlying action at all in the bounce, which is what I expected to see and wanted to see.
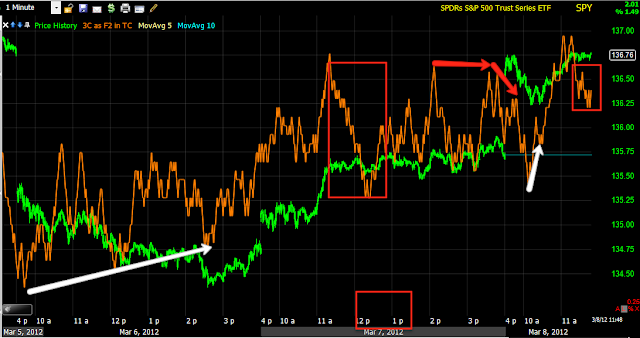
SPY 1 min with the same positive divergence to the left that started the bounce, the same strange 1 p.m. negative yesterday, a negative on the open sending it lower and a positive at the lows sending it higher, there' a slight negative in place.
Today's action on the 1 min, shows the opening negative, the positive at the lows and the strat of a leading negative.
The 2 min chart is interesting, since the positive divergence starting the bounce, the leading negative divergence ha just grown, really starting at 1 pm yesterday.
A closer view of the 2 min, SPY remains in a negative divergence, both relative intraday and leading on a longer term basis as seen above.
SPY 5 min I think is pretty clear.
We have had some gap filling, but for a real head fake move, there would need to be a close above the red trendline in any of the averages , this is the SPY.
The QQQ may be the best candidate for such a move...
The DIA
The IWM, I don't think this has much of a chance.
And here's what it would take on a closing basis in AAPL
As mentioned yesterday, we did see a head fake move Monday a.m. that sent AAPL lower, but I'm starting to wonder if the action since the 15th in the yellow box has indeed been the head fake move in AAPL, a break below the red trendline on volume would confirm this.
In any case, all of the averages are showing very weak underlying 3C readings in to the advance and the market is starting to look more like a small bear flag, meaning perhaps we have already seen the break. The 3C trade shows the weakness in the move since the bounce started.
I'm going to take a look at some other indications and post them.
Is interest rates about to start going up?
-
Yes, I know - it does not make any sense - FED is about to cut
rates...but....real world interest rates are not always what FED wants it
to be.
6 years ago


No comments:
Post a Comment