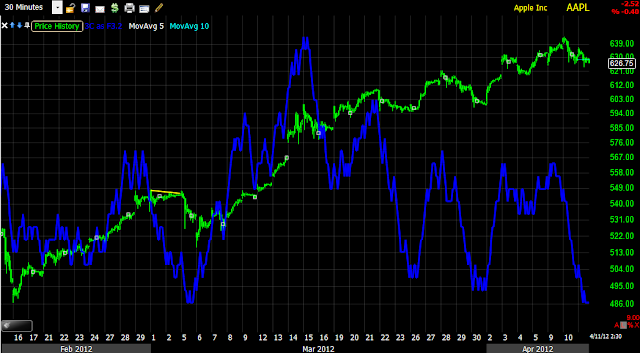
AAPL is down -.38% vs the SPY at +.91%, which is wieghing on the NASDAQ 100 (yesterday this looked to be among the weakest of the bounce candidates-this also happened on the last bounce that started on a Friday, the SPX and Dow moved, the NASDAQ didn't at least until Monday when it outperformed).
Basically though, thi is the gut feeling I had, AAPL underperformance, there's a reason for it.
Yesterday in my 3 Pillars post, I said it looked like financials would lead the bounce, financials are up +1.87%, Tech +.68% and Energy +.41%
However, I believe to get the market moving, they'll need AAPL and smart money doesn't want to sell AAPL in to weakness nor short it in to weakness, so I fully expect that AAPL will make a move higher, it needs to, but thus far the early weakness is encouraging. I think they probably unloaded as much AAPL as they could today without driving prices too far against them. I'll be looking to re-establish a new position in AAPL in May or maybe June Puts after having closed April Puts yesterday at a small profit as the time decay factor for the move I'm after in AAPL was working against the trade.
Here's the break on a 5 min chart, I show you because this is a common theme, a trend down and a break of support with a bullish candle ( a hammer and Harami in this instance with a bullish engulfing candle after for confirmation) and large volume, this is almost always an intraday and often a reversal on daily charts as well. In fact it even works for multi-day charts and works in a move down like this or the opposite, a move up. Think of this as mini-capitulation, in the opposite, a break above resistance with a bearish candle and high volume, think of that as mini-churning.
And we see the start of an intraday positive divergence after the break on a 1 min chart.
We have the same on a 2 min chart. So these are the tactical timeframes, note I haven't started any short trades yet, nor closed the bullish USO trade, I'm being patient and waiting for a better move up, although it is nerve racking.
Strategically, the 30 min above and 60 min chart below are very negative for AAPL, this is the reason I want to be short AAPL, but I want to do that in to some price strength.
Actually I'm quite impressed, for the first time in AAPL's recent uptrend, even the daily chart has now gone negative and that takes a lot.


No comments:
Post a Comment