This is the daily AAPL chart, the upper trendline of this triangle is what we wanted to see broken to the upside after AAPL's horrible performance in the early part of the move off the April 10th lows, it's also finding some support in the area.

On a 15 min chart you can see the huge number of stop hit on this morning's move down, this would give Wall Street a chance to accumulate those shares for one last blowoff top without arousing too much suspicion as someone has to take the other side of the trade. Note again some support in the area of the descending trendline.
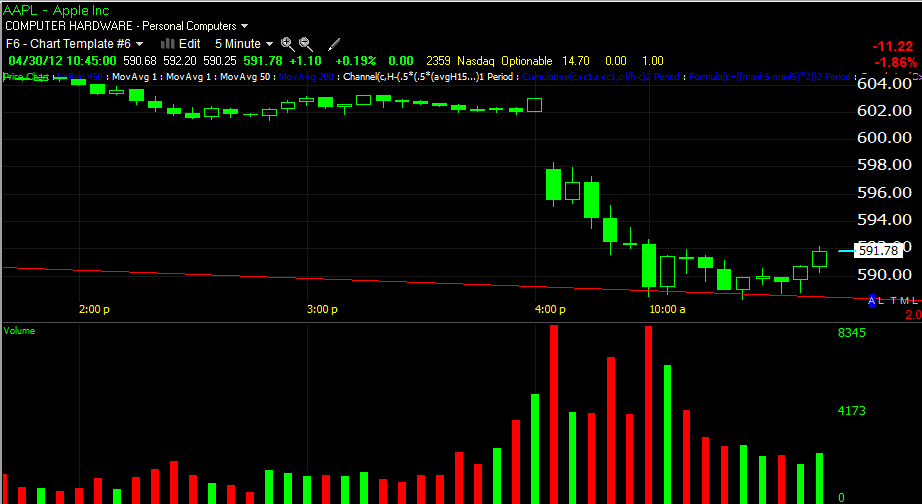
On a 5 min chart, it looks like more support. I would think that a "U" reversal straight up from here would be difficult, but I suppose they don't need that many shares to get AAPL to pop one more time, it's just not a typical reversal pattern, usually I'd expect to see another move lower and a small "W" bottom or maybe even a brief break through that support trendline. Almost every reversal is preceded by a head fake move on any timeframe chart.
The 1 and 2 min charts still haven't confirmed the downside move and have had plenty of time now.
The relative divergence that I wanted to see hold up on the 5 min chart in the last AAPL post, thus far is doing that, we'll see if it can continue to hold, this would be bullish for AAPL to stage one last blow-off move as the 1-2 min charts imply.
Don't lose sight of the bigger picture though, the 60 min chart, AAPL is in big trouble here. I'll add to the position on a blow off move higher.


No comments:
Post a Comment