Being BIDU looks the way it does as well as the QQQ update, I thought I'd check the other two tech stocks that were showing positive divergences late Friday, AAPL and PCLN-as well as XLK (Tech Sector).
AAPL's 60 min chart (posted last night) has shown how much underlying damage has been done in AAPL, even while AAPL looks relatively flat, this is where we almost always see the strongest divergences, in to a relatively flat area, although AAPL is clearly rounding over. Take a look at the parabolic move of 2012 in AAPL on a 5 min chart and you can see the "what goes up must come down" concept of parabolic moves is taking place in AAPL. Today AAPL broke another support level, but I still see no reason why volatility won't continue to increase, making for some potential big swings. I'll be looking to start an AAPL equity short (tried that last week but put in a fat linger long instead).
As suspected, AAPL 1 min showing strong 3C leading positive momentum. Late Friday in the model portfolio after the AAPL, PCLN, BIDU post, I did manage to squeeze in an AAPL May $570 call in the options model portfolio.
AAPL 2 min is seeing the strength bleed through.
a new 3 min chart is showing the same.
AAPL's 5 min chart is seeing one of the stronger positive divergences it has seen in the last few weeks.
I'm not sure what the play is here, earnings? The F_O_M_C? Or just plain old volatility?
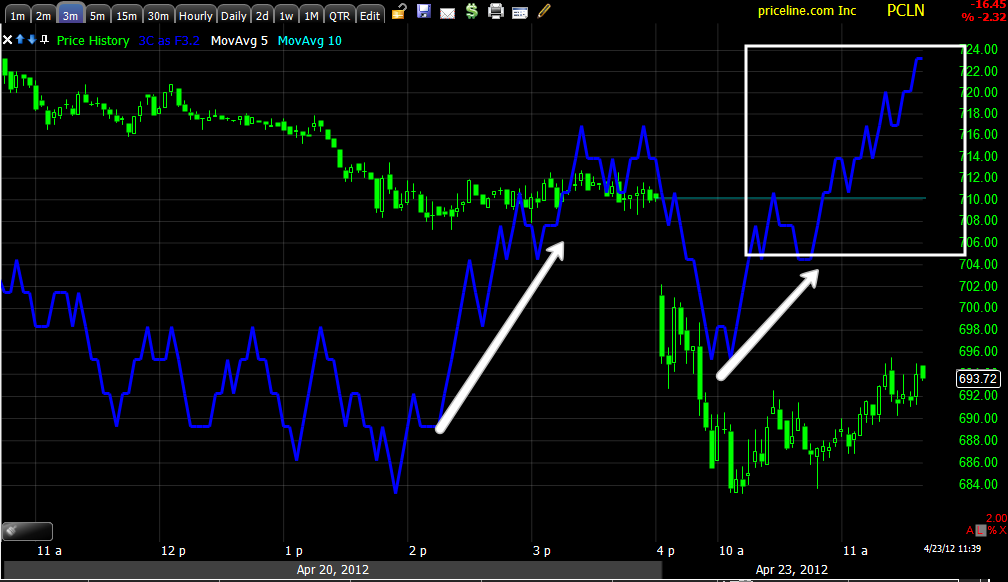
PCLN also broke the area I considered to be a top formation, although not large, PCLN is also a parabolic mover, look at a 5 day chart and you'll see the parabolic move failing, a large top would not work for the parabolic failure. I'll be looking to start an equity short in PCLN which should have already been started by now, but placing trades in the model portfolio is the last priority for me in a fast moving market.
PCLN 1 min is continuing to put in a positive divergence, it does appear that whatever Friday's late day plan was for Tech, is not being abandoned quite yet, although I suspect adjustments will have to be made because of today's open, this could lead to a very volatile 1-2 day move, still when looking at the bigger picture, almost anywhere in this area seem like a decent place to start building a position, the 5 day chart should show you how much potential downside there is even from here.
PCLN 2 min
PCLN 3 min
a relative positive divergence on the 5 min
Tech has broke its rounding top, be sure to see RSI 6 at the bottom of all these daily charts.
XLK 2 min leading positive
XLK 5 min leading positive
XLK 15 min relative positive.
This market does not seem to be done with volatility moves. I continue to view these moves as opportunities with options on very short trades, but they are getting more and more speculative and dangerous. This is why I'm trying to cautiously transition to straight equity shorts so I don't have to worry about strikes and time decay.


No comments:
Post a Comment