IOC is a short trade from January, it's looking decent here for a new position or an add to.
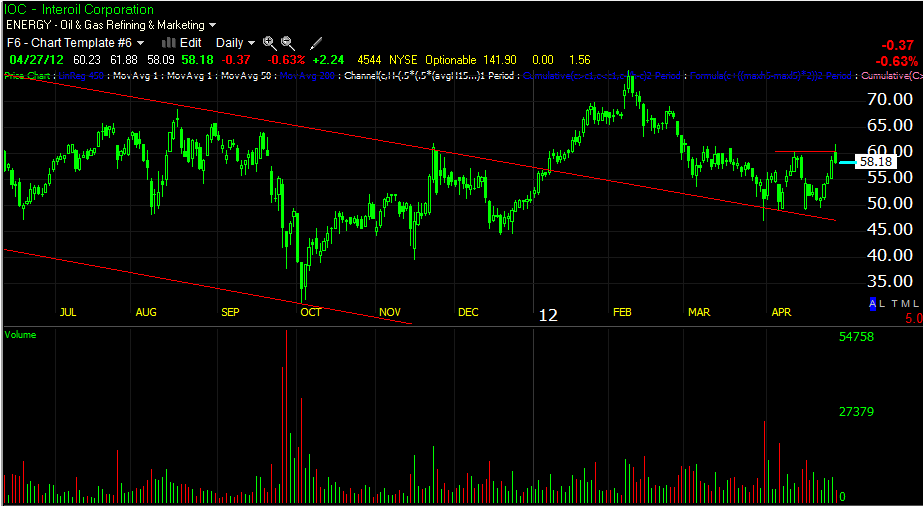
IOC was in a clean downtrend, it used the 2012 rally to breakout of the down trend, but I never though this was a real move of strength, more likely a shakeout. We had some short positions in the red box, the white box just shows large volume at support, a typical reversal signal. The ultimate move in IOC would be a break back below the channel support, in which case IOC should head down to the lower channel pretty fast.
IOC staged a breakout above support and failed.
The MoneyStream Daily chart shows weakness in to the move up.
Here's today's attempted breakout, there was a nice negative divergence at the attempt.
You can see recent deterioration and a negative divergence at today' attempted breakout, it looks like a quick head fake move.
The 15 min chart, especially at today's move, which looks very bearish in price alone.
The 30 min going negative at today's attempt to break above local resistance.
And the 60 min chart falling apart fast.
There could be a little more upside, maybe another head fake move, but the risk here looks reasonable with a stop in the $62.50 area (although the wider the better until it breaks back below the channel support.


 | Theme by Thur
No comments:
Post a Comment