The SPY charts that are first, are a more complete update as to expectations, as you know from the last post, I do expect a short term pullback, at this point there's nothing to suggest it is serious as it doesn't go beyond the 3 min chart in most of the 4 averages. I was waiting for the 15 min chart to start showing positive signals which would help us confirm what I suspected, that the move down since 6/19-6/20 is a pullback. In fact now even some 30 min charts are seeing positive action bleed through.
The rest of the charts are just the short term intraday for the averages as the longer charts all pretty much look the same as the SPY
As you can see the 2 min chart has deteriorated more today, there's no sign of the positive divergence as the 1 min chart above shows so it can't be very strong. The deterioration in the 2 min chart suggests as I speculated this morning that there will be a pullback in the market.
SPY 3 min chart tends to confirm the pullback
The 5 min chart is nearly in line with price, it has a minor leading negative divergence, this timeframe is in line with a pullback.
The 15 min chart is unaffected and leading positive, again this suggests the pullback is nothing more than just that which is normal, especially in this market with the volatility and choppiness. As explained this a.m., it would give the pros a chance to accumulate more in to lower prices as they very rarely chase prices higher.
CONTEXT for ES also has diverged today, this is inline with the pullback scenario.

The SPY arbitrage model shows a similar reading since today's open.
ES has seen many more negative divergences intraday than positive, but we do have a recent positive as mentioned above.
DIA 1 min, slight positive at EOD, larger picture is a negative divergence.
2 min confirming
3 min confirming
IWM 1 min also showing the late day positive divergence
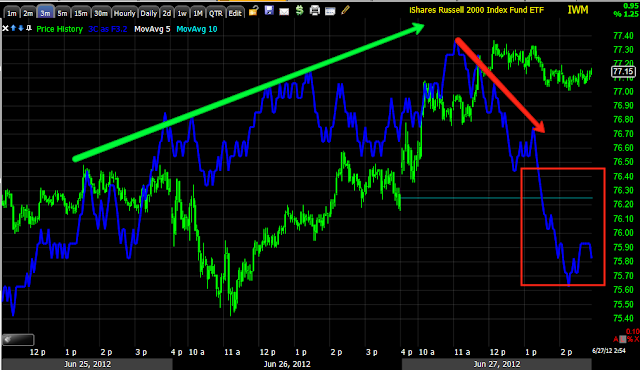
The 2 min chart shows a bit of positive action at the last hour or so, but the bigger picture is the negative divergence confirming the 1 min for a pullback/consolidation.
IWM 3 min
QQQ 1 min-so far we have excellent confirmation among the 4 averages.
QQQ 2 min
QQQ 3 min is longer than the above 2 charts, therefore more important for the short term trend and again this suggests a pullback/consolidation.


No comments:
Post a Comment