It's been a VERY long time since we've looked at URRE. There are two stocks or it may be better to say industry groups, that I do like on a long term secular basis, one is UNG or Natural Gas and the second is URRE or Nuclear Power.
For a long time we've been watching the changes in character in these two, UNG seems to be further developed, but at the time we had no idea why. I don't know for sure if this is the reason, but it sounds reasonable. A couple of months ago, long after we were first interested in the to, a new regulation was being passed that would cap environmental emissions on any new Electric facilities built in the US, that meant the only two sources of energy that would qualify would be nuclear or Natural gas. It seems even clean coal technology wouldn't pass the hurdle.
I view these both as very long term positions.
Here's what UNG looked like
UNG's long term trend and change in character.
UNG closer view, although it's difficult to say for sure this is the base and no more, it is less difficult to say these has every hallmark of a large stage 1 base.
I tend to think UNG/URRE and some related issues are more than just a probable bull market, they seem to be more of a secular change in trend, meaning even longer term. Above is a curious chart of hOV, a homebuilder under accumulation during the 2000 Tech crash. After just having gone through the Tech revolution, who would have thought housing would be the frame to lead the next bull market?
Here's what HOV did since that rather small accumulation area pointed out above, approximately a 2500% return.
URRE has the classic bullish descending wedge, last year we saw a lot of these and none of them acted the way Technical Analysis teaches. TA says when price reaches the apex of the wedge, there should be an explosive move up (for a descending wedge like this and the opposite for an ascending wedge), but we noticed that wasn't the case. Often there would be an initial head fake move in the right direction as you can see here in yellow, but every one of these whether ascending or descending always formed a lateral base or top (depending on the type of wedge) before actually moving in the direction the wedge predicts. If URRE holds true to that model we have seen so many times, then URRE should be building a base right now.
A daily chart close up of URRE with a rectangle consolidation. A rectangle has no inherent bias unlike some other consolidation patterns, the preceding trend is what gives the rectangle its bias, in this case technical traders would consider this a bearish consolidation and expect a break below the rectangle which URRE has started to do. Of course we have seen MANY bear traps created this way and back in March-May, many bull traps as Wall St. takes advantage of the predictability of technical traders.
The daily 3C chart of URRE in a positive divergence at the apex of the wedge and a leading positive as URRE has moved mostly laterally with a slant to the downside.
The daily MoneyStream chart shows a similar leading positive divergence in URRE.
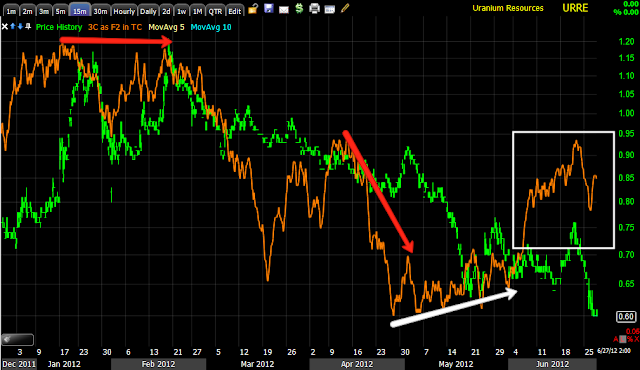
The 15 min chart shows a recent small double top with a negative divergence and another negative around the start of May, there has been a recent positive divergence in the area of the rectangle.
The 30 min chart shows virtually the same thing and the 15 min has bleed over to the 30 min.
The 60 min is in positive position, but has not seen the 30 min chart's most recent move bleed over to the 60 yet. It's worth keeping an eye on as there may be a head fake move here to take advantage of.
For those of you using 3C, note that I didn't use any charts below 15 mins., that's because URRE's trade is so spotty, on this 1 min chart there are plenty of bars with no trade at all, as 3C is a look back indicator this would give you inaccurate readings.
Even the 10 min only has a 1 cent trading range, this is not conducive to good reading with 3C, in these cases you want to try to stick with the longer term charts.
I'll set some alerts for URRE and see if this is an actual bear trap under the rectangle. Without the shorter term 1-5 min charts, it's more difficult to see what's going on.
Is interest rates about to start going up?
-
Yes, I know - it does not make any sense - FED is about to cut
rates...but....real world interest rates are not always what FED wants it
to be.
6 years ago


No comments:
Post a Comment