Here's the Nat Gas injection for this week
| Released On 7/19/2012 10:30:00 AM For wk7/13, 2012 |
| Prior | Actual |
| Weekly Change | 33 bcf | 28 bcf |
|
|
Consensus was for an injection of 30 bcf.
The reaction, so far is just about as flat as the miss... |
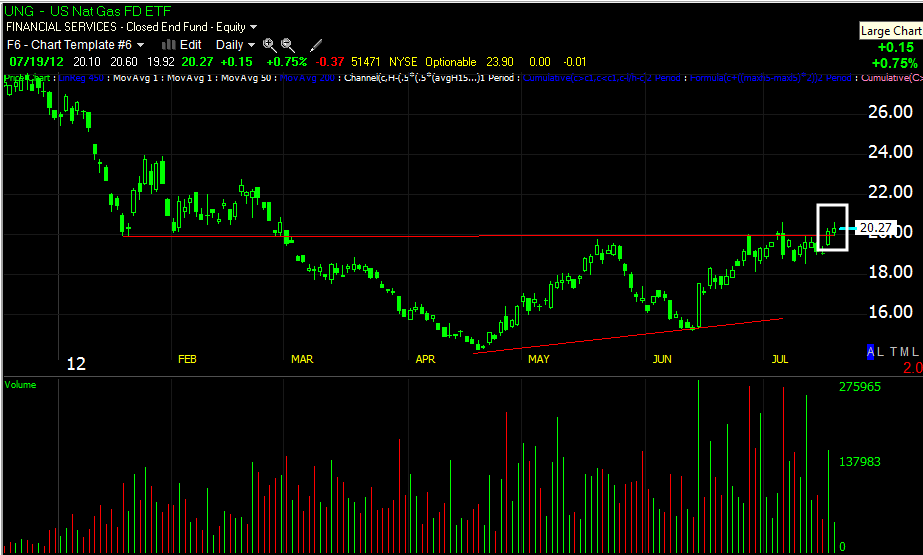
A triangle just above the resistance level in UNG.

|
The daily chart, just above resistance.
This 60 min chart looks very strong, it looks like UNG has built a solid base from which to breakout from. This is why I will hold UNG even in the event that I think a pullback is the most logical probability.
The short term charts up to this 15 min chart have been looking like decent pullback has been in order, yet UNG keeps hanging in the region of a breakout. Now the 15 min chart is even seeing some improvement. UNG has always been considered a long term trade idea, so I intend to treat it like one, I will remain long UNG stock and look for any opportunities to add to it. I believe a breakout will lead to stage 2 mark up, which is where the bulk of the trending occurs.
|


 | Theme by Thur
No comments:
Post a Comment