As for FB Calls, I have Aug 27 and 28 and I see no point in selling them now. There are a few interesting things about the FB chart, but as I warned when we first looked at FB as a long and many of us made a LOT of money on FB when ALL is said and done, the main problem was FB's limited trading history, that was the risk when we first went long at the bottom, that's the same risk on some of the signals now; it worked out fine when we first went long at the bottom, maybe in fact it works out fine again, but that is the risk. Now for the charts, which are also difficult to display as the price scale was just changed and the limited history in FB also makes scaling difficult.
(Also don't forget the RIMM trade that was before earnings, we went long on positive divergences, after earnings RIMM fell about 9% and we held based on positive signals still, a few weeks later they had a major management shake up and the trade turned in to a nice profit, the positive divergences were there for a reason, just not the one we assumed)
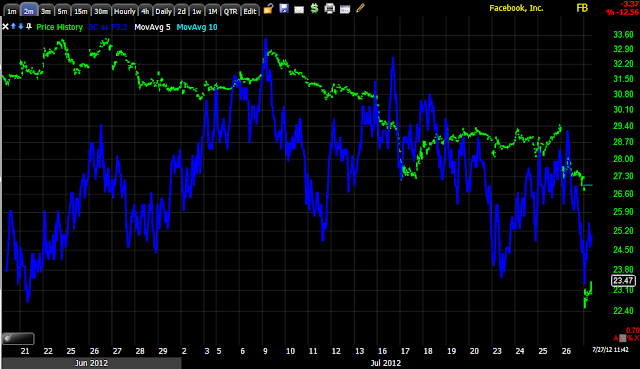
The 1 min chart, speaks for itself I think
Here's where it becomes difficult to show a 2 min chart correctly because of maximum bars allowed in the software and the actual 3C trend, you'll understand better in a moment.
For now we'll use the intraday 2 min chart which has been going positive most of the morning.
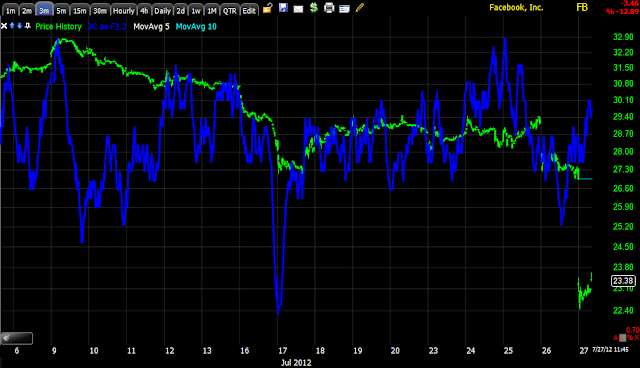
Here's the 3 min chart displayed with the same problems as the 1 min chart, but because the 3 min chart is a longer timeframe it has more history, now lets zoom this out to full zoom and check the trend (something we can't do with the 2 min chart).

This shows the selling in to strength and the reason I wanted to wait on FB and look for positive divergences before adding too much, the 3 min chart seems to show us a pretty positive trend despite today's gap down.
Now that you understand the scaling issues, I'll just show you what was important on the 5 min chart, the negative divergence, which by the way is not all that negative, but enough for me to want to wait for a more positive set up before entering FB again after a successful initial trade-also the reason I didn't really like the idea of holding FB without positive signals, well today we have some positive signals, in fact a bit longer than just today.
The 15 min chart shows a pretty long relative negative divergence, but not a sharp leading negative divergence, which makes me question as I did weeks ago, "Just how strong is the actual distribution that took place?" We also have a 15 min positive divergence, interesting.
A 30 min as well
Now, this is the 60 min chart and I show it to you this way so you can really see the scale of things, that white box at the time, was a HUGE leading positive divergence, REALLY big, that's the reason we got long the world's most hated stock and made good money doing it. So now we have price below that level, but 3C as of now (and maybe it takes some time, but I'd think it would have happened by now if it was going to), is still up quite a bit higher forming what can only be called a leading positive divergence. So yes, I'm holding the FB position, maybe I'd even consider adding, but that would be on the merit of new signals as a new trade.


No comments:
Post a Comment