I also mentioned ACI on July 30th as a potential long we might get shot at on a pullback.
Here are the charts thus far, although it's still very early in the day and a funky day at that. Perhaps we will get a shot at this one playing in to our hands, it's worth keeping on your radar.
This 60 min leading positive divergence in a small base-like area is what caught my attention, the recent parabolic move is what made me think we might get a shot at this one long on a pullback as parabolic moves rarely hold. In addition, for a divergence of this size already, I'd expect a little bigger price base as we rarely see "V" shaped reversals.
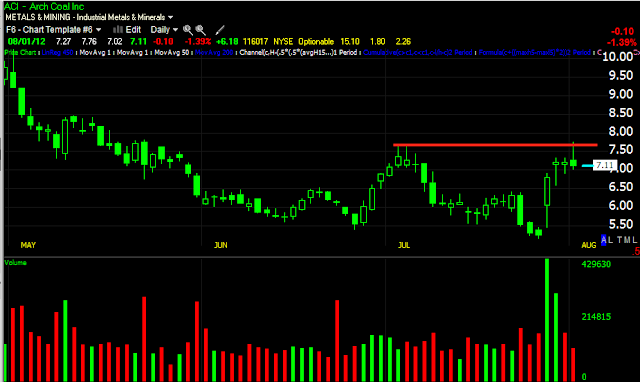
Here's the daily chart, today's candle THUS FAR, is a short term bearish reversal candle called a "shooting star", at least it's VERY close to one, the psychology is the same.
Here's the short term 3 min 3C trend, which looks like a near term pullback was in the works any way.
As for target areas...
The 10/22 day ma's are a reasonable target, however the market isn't always reasonable.
Here's a longer term Trend Channel stop , the area is around $6.00, this doesn't preclude the possibility of a move below the bottom of the base at $5.00, which would be a VERY interesting set up.
Is interest rates about to start going up?
-
Yes, I know - it does not make any sense - FED is about to cut
rates...but....real world interest rates are not always what FED wants it
to be.
6 years ago


No comments:
Post a Comment