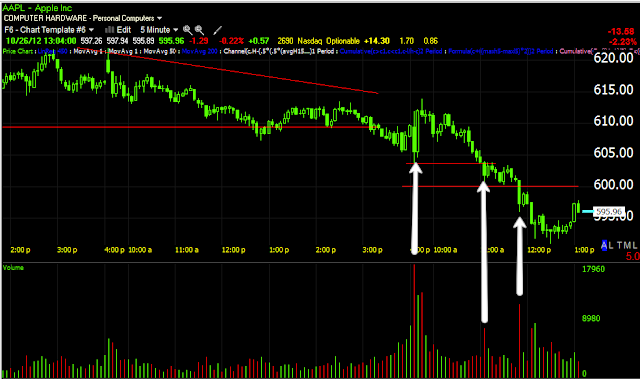
The view from the perspective of technical trader's... The preceding downtrend from last week makes this descending triangle the perfect consolidation/continuation pattern, but technical traders are big on confirmation, that means the break below support and you can see volume jumped on that break. The head fake would be complete with a move above the apex of the triangle, the higher it goes, the larger the shorts' loss and the more they cover creating a snowball effect or , "From failed move come fast moves".
The break of the triangle, then break of intraday support and larger volume on the break of a century mark at $600 which is a magnet for orders.
The 1 min leading positive this afternoon, but that's the least of them.
2 min leading positive as $600 was broken.
The overall 3 min trend in leading positive position suggesting this is a head fake break and a leading positive move today.
This is a closer intraday look at the 2 min leading positive
And the 3 min intraday leading positive, both impressive.

And the 5 min chart since the positive sending AAPL up last week, the negative sending it down last week and the positive at the formation of this triangle, again this suggests the move will be a head fake move.


No comments:
Post a Comment