Amazing how on a day like today with virtually no one on Wall Street, a day I thought would be absolutely useless, we are getting some great signals.
As I said in the last post, there's distribution (selling) in to today's price strength mostly on the back of a weak dollar which sends risk assets higher. The distribution is in the intraday timeframes meaning it's small scale compared to the size of the cycle (but could still look nasty while it's happening) and that means it's along the lines of the pullback in the market I expect,
see Wednesday's last post which made it very clear.
As I said before whether we see some intraday decline today or not doesn't really matter, it appears some last minute inventory shifts are being made in anticipation of the pullback that the market has been telegraphing-our opportunity. If I were a VERY aggressive trade, which I don't think we need to be right now, I might take some SPY (or IWM) Puts for early next week.
DIA 2 min chart, looking at the intraday negative leading divergence today-distribution (remember this is not heavy distribution that effects the trend over weeks, months, just intraday and day to day-as in our pullback)
DIA 3 min also showing distribution, I will say the Dow is one of the stronger looking averages as far as near term trade.
IWM 1 min intraday leading negative today.
IWM 2 min leading negative
QQQ leading negative 2 min

QQQ leading negative 3 min
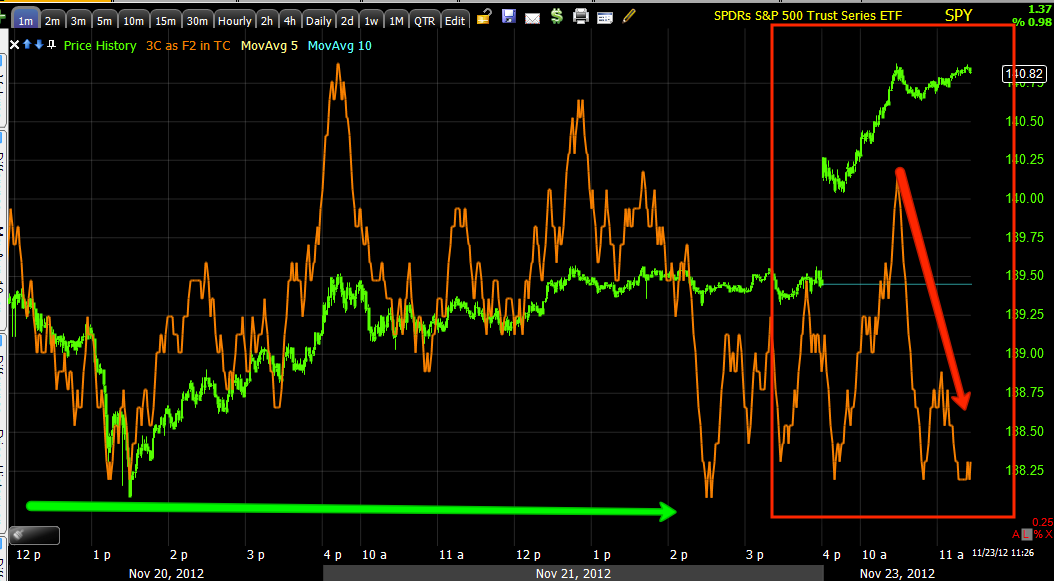
The SPY 1 min on an intraday basis was in confirmation until late Wednesday and then again today as it gets worse today .
SPY 3 min leading negative.
All of the longer term charts where the heavier institutional action can be found are still looking great so this still looks like a constructive pullback at the start of the bull trend, it may get ugly, but I have no doubt it will be an opportunity.
Now check out the NYSE TICK chart (all advancing issues minus declining issues) for today. Remember how great this looked all this week?
The SPY is there for comparison in red, note early on we were seeing pretty positive +1000 readings this morning, but at the same price level that has now dropped down to the +250 to +500 area, this is what wasn't happening early in the week as the TICK looked very strong. The bottom line, at the same relative price area more stocks are starting to decline vs the earlier move today, no sector rotation to support the market.
The S&P Futures (ES) 1 min also going negative intraday
Here are Treasuries, the flight to safety asset when the market declines, note the 2 min positive divergence.
Also a 5 min positive divergence, some money is flowing in to the safety f treasuries as they know and have known all week that a pullback was part of the early trend. For us this is probably not worth trading as they are trading in 10k lots and most of us in 100 lots, they can make money on the volume/size of their positions, for us not so much.
In case you were wondering about the longer term trend, the one that shows the market is in a bullish phase and should move higher over the weeks and maybe months/s to come, Treasuries on a heavier distribution basis went up in November just to be sold hard in large distribution, that's how the market works, they buy weakness and sell strength.


No comments:
Post a Comment