It's not so much the indicators as it is the concepts as many indicators can serve similar purposes.
The first clue that there was going to be a correction or in this case a loss of momentum could be found in the NYSE TICK data, I have linear regression trendlines set up on the SPY above and the TICK data below and then I have another indicator at the bottom, TICK multiplied by price which also serves to highlight divergences, but you don't need all of this, you simply need the TICK data which is "$TICK" for Worden platforms. You have to be able to distinguish whether or not there's a divergence between TICK and the SPX which you can do by drawing trendlines around the TICK. Here we see the TICK is stronger than the average suggesting a loss of momentum which can lead to an intraday reversal.
The fact that price broke the popular 50-bar 5 min moving average also is a warning sign, not that you should jump in short as most traders like to use it, but a warning that there' likely to be volatility in the area as traders can be enticed in to positions with moves above and below the average as it is so closely watched. The Trend Channel did give a negative signal in red, the white is not a stop because it did not close below the channel, only opened there. However until the Trend Channel is clearly trending down, there's a lot of room for games, what the stop out on the channel told us was the easy money playing the short side is over.
There are many different indicators that will work here, but on a 1 min chart I'm using a momentum indicator that went negative t the top and positive recently. I'm also using a fast Wilder's RSI (not the same as Relative Strength Index-RSI only, there's a difference as Wilder's RSI compares the symbol against its own momentum whereas RSI compares the symbol's momentum against a comparison symbol, you want Wilder's RSI).
Looking at the rest of the indicators in this screen, MACD went positive, but note the very long settings used (26/52/9) to reduce noise and Stochastics which I use primarily for embedded signals was embedded during the downside momentum, but broke loose as the white box-all signals something has changed, albeit short term, bigger changes typically start with small ones..
A VERY IMPORTANT piece of data is knowing which asset is the pivot asset for the day, yesterday it was AAPL, before that GOOG, today with the break above the nearly 2 week triangle in the EUR/USD, it is the pivot asset and many clues can be found in that asset alone. Note as we saw the initial signals above of changing momentum, 3C shows an intraday positive divergence in the FX pair.
Here's the bigger picture of the breakout at the time...
And a closer view-a break below the trendline and ultimately below the triangle is a huge bearish market signal, but since it's such a common pattern and every technician thinks they know how to trade it, they're going to manipulate and shake the tree hard.

This is ES with 3C, it looks as if it is going negative here, but the fact that the 3C move down was even interrupted is a signal to pay attention to.
After 15 mins or so, the EUR/USD 3C signal becomes even stronger and since has seen the pair move up in price a bit.
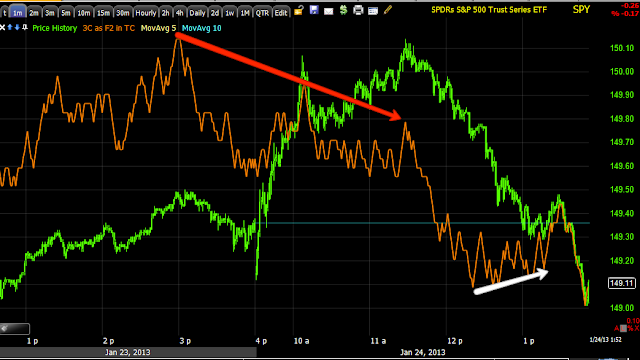
The 1 min 3C chart of the SPY looks like everything is back in line, but the fact is momentum changed significantly from earlier.
What is probably one of the most important things to note is the fact that price in the SPY which was significantly higher and is now in the red, is not too far from the first resistance zone that traders will watch, that's yesterday's close at the yellow trendline. If thre's to be volatility to shakeout players as I have suspected since I first saw the EUR/USD triangle, this is a perfect area to do so.
However you don't want to get lot in the lines, always keep things in perspective.


No comments:
Post a Comment