Without seeing internals
and trying to keep other things in perspective such as reduced liquidity/participation in the Far East, the G-20, the new seeming disturbance inside the ECB as of this morning with Weidmann trying to upstage Draghi as they take polar opposite views on the race to debase the Euro with the rest of the world-Japan is winning of course. You might recall my quip wondering if, "Draghi had responded yet?" Well in his stead are the French who have been the most vocal in complaining about a strong Euro, "
EURO GROUP MUST WATCH RISING EURO'S IMPACT ON GROWTH: MOSCOVICI (French Finance Minister)"
It's difficult today to judge whether anything or any particular signal means something or not, it would be like trying to judge whether a rally in stocks had legs when the Bond market or the currency market was closed, you just can't view these things in a vacuum, they are all connected, even rumors.
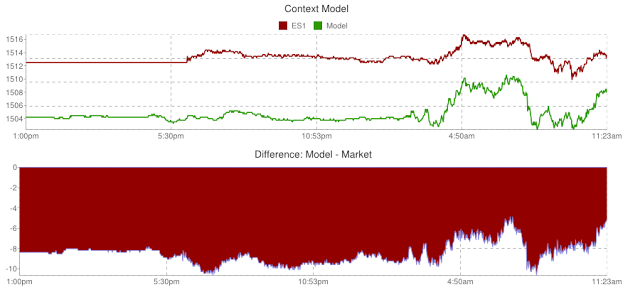
I will admit the one thing I really don't understand is how CONTEXT's ES Risk Model vs ES changes so strangely. It's almost as if there's a rolling 24 hour period i which it resets, but has some strange look back that discounts anything before a certain period, it's certainly not a cumulative indicator as useful as it has been in the past, here's an example of the market/risk assets looking very bearish earlier today vs the exact opposite right now, but there's no segue between the two.
The information is delayed about 30 minutes or so, this above model of ES was posted around noon today with the risk model totally risk off vs where the value of ES was, it was at "-10" so a pretty big disparity between the model and ES.
This is the 2 pm update. How is it that we went from -10 to risk assets leading ES at +5, but on the chart since 2:30 a.m. above, there's no sign whatsoever of the earlier lows of -10? I've see this before and just don't understand their modeling.
In any case, this is partly why we use out own and ours is broken down to see where the actual changes in risk assets are rather than in the aggregate.
Lets look, but keep in mind there aren't any signals in the averages on 3C charts that would cause me to take even a short term, 1-day options trade like we have been doing successfully nearly the last two
weeks (long and short).
Also just as I said last night, "My attention will really be on the carry trade currency pairs", I think other than a few areas, the main shorter term pivot are the currencies.
*All assets are compared to the SP-500 in green unless otherwise specified*
Commodities vs the SPX are a risk asset, they are down today as the SPX is rather flat in a larger version of Friday's "Pseudo Bull-pennant".
Why?
Here are commodities on the same timeframe except I changed the green comparison symbol from the SPX to the $USD (UUP), commodities are acting exactly s they should, mirror opposite the $US Dollar.
FCT, for newer members, has been a good lading indicator that went negative vs the SPX and right at the time the change in character started in the SPX with wider daily ATR and increased volatility.
Today's NYSE TICK so far, not much on the upside, some earlier nasty -1000, but all in all a very balanced, dull market and dull markets always have me on edge.
Since we got a buy signal on the VIX (sell for the market) and volatility went from the widest of the year to the tightest, indicating a highly directional move is coming, my first words were "Price will likely loiter in the area for a while, crossing above and below the media" and that's exactly what it has done (yellow), I still think the buy signal is the more important take-away along with the Bollinger Band Squeeze.
High Yield Corp. Credit (HYG) vs the SPX is not following as it has not been for some time creating a very bearish dislocation for the market between the two...
Longer term Credit fell off a cliff when volatility in the SPX picked up, it no longer leads to the upside, no longer confirms, but leads to the downside.
However looking at HY Corp. Credit with 3C and we can see the distribution or negative divergence at the top and a recent positive divergence as HYG has been flat the last several days, a perfect area for accumulation.
Credit led the market's November 16th new cycle up, it bottomed at least a day before, it was in line at the green arrow, going negative at the red arrow and seeing a short squeeze at the red box/leading negative divergence-distribution, now we have the positive divergence which is at support from the start of trend 1, but when we look at it in scale, we can see the recent 3C lows are below the Nov. 15th bottom in 3C, so I think this is an oversold bounce or short shakeout move, not so much a revival in the health of credit.
Junk Credit behaves almost exactly the same as HY, the recent refusal to follow the SPX even intraday and scaled out...
A deep leading negative divergence which have helped us call so many tops and bottoms (if the signal were reversed) which is why we use these indicators.
Currencies...
The $USD has recently put in a powerful 5-day move to the upside, this isn't good for risk assets including stocks-you saw commodities above, however t looks close to breaking the channel, probably because of Weidmann's comments earlier today.
The $USD intraday 1 min is down, the market really should be up intraday here, why isn't it?
The Euro is also slightly up, so again why isn't the SPX following it to the upside?
Here the Yen, so important in the carry trade basket had been helpful to the market at the green arrow, at yellow warned of caution, at red was getting dangerous for the highly leveraged market and was down today on comments from the presumed next Japanese Finance Minister, but I don't think this show is over for the Yen and this is what is really key right now, especially as it relates to a fast move in the market with what I believe has more downside risk than up.
The Yen intraday is down, so again, why is the SPX not up?
I'm going to show you some 3C charts, you know I lie to take what the market give even if it is a 1-day trade, but I don't want to take risks that aren't warranted, so far from what I see in the 3C charts, the risks aren't warranted and we've taken one of these types of 1-2 day trades quite often over the last 1.5-2 weeks.


No comments:
Post a Comment