I have an open SLV $20 Put with a Sept. 21 expiration so I think it will be fine.
What I was looking for last week in entering the position was a quick pullback in gold and silver and then a new high (locally) in both PM's.
I'm not taking any longer term positions in either as I suspect at least gold and probably silver too will pullback much more significantly to what might be considered the base or the lowest recent lows before either makes another serious move to the upside and that pullback needs to be confirmed before even considering taking a longer based position.
GLD 1 min seems to be at least in line if not suggesting an EOD ramp. as of this capture,
since GLD has deteriorated on this timeframe.
The 2 min chart suggested the same as the 1 min chart did before deterioration set in. So far the 2 min chart looks the same,
but if 1 min deterioration is setting in, it will likely hit the 2 min chart soon and we should see a pullback in both PMs.
The GLD 10 min chart CLEARLY suggests a pullback before any more significant upside activity.
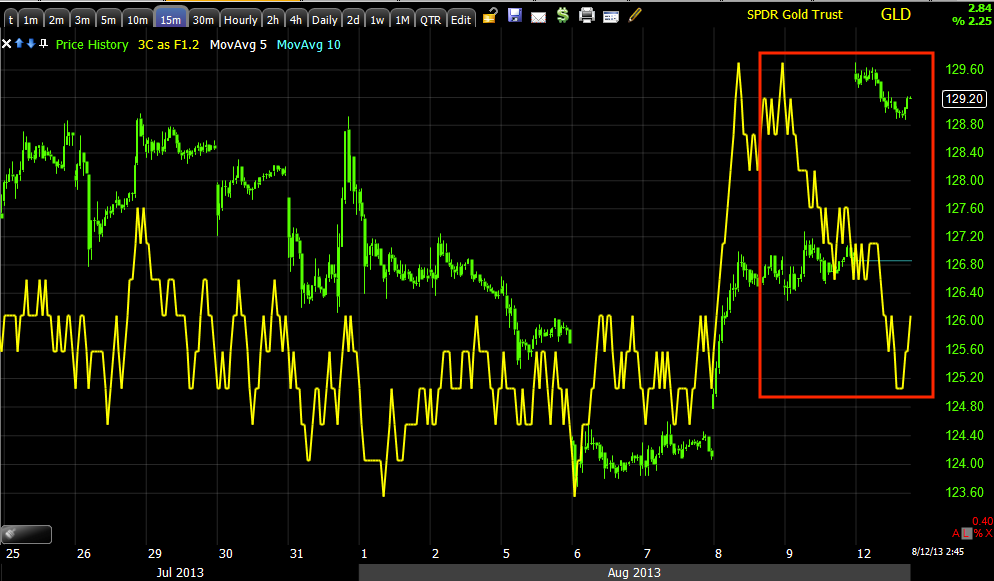
The GLD 15 min chart suggests the same,
I would not want to be on the other side of the 15 min chart in any scenario right now until we see a pullback in GLD.
The longer 60 min chart suggests as I suggested last week, that we will see a tradable pullback in the PM's before they make a new short term move higher.
Gold futures...
The Gold futures 5 min chart clearly suggests a pullback in gold
You can see even the 30 min chart is suggesting the same.
SLV's 1m intraday chart saw some late strength intraday Friday and seems to be suggesting more as of this capture.
There's been slight deterioration since the capture, not as much as GLD
***If there was a clear signal with high probabilities I would consider adding to the Sept. SLV put which also means I'd consider it for a new position as well if you are interested.
The SLV 2 min chart was in line from late Friday intraday strength, but looks worse than the GLD 2 min looked.
There has been some slight improvement since this capture, I'd call it "in line".
The 5 min chart clearly suggests downside in a tradable format on a 5 min chart.
The longer term 30 min chart (much like GLD) suggests that we will see a move higher after a pullback,
however none of these moves are what I'd consider to be positions that are worthwhile without some leverage, at least 2x ETF in my view.
The Silver Futures 5 min also suggests a significant pullback...
The 30 min suggests a pullback, but the broader view is after a pullback a new local high which is exactly what was expected last week when entering the Silver put for the pullback.


No comments:
Post a Comment