I was just flipping through watchlist charts and said to myself, "Look at that triangle in MCP!", it just goes to show how cluttered my brain is because as I turned on the chart's drawing tools I noticed I had already drawn the trendlines around the triangle and the triangle I remembered (well it is Friday, it has been a long week for me) was why I mentioned MCP as being a possible head fake (shakeout) candidate on a market pullback.
So if you are interested in entering MCP as a new long or even as an add-to position, here's what I'd be looking for and if you are long and wondering if this means I'd trader around a potential pullback in MCP, the answer would be the same as TECL (long), "No".

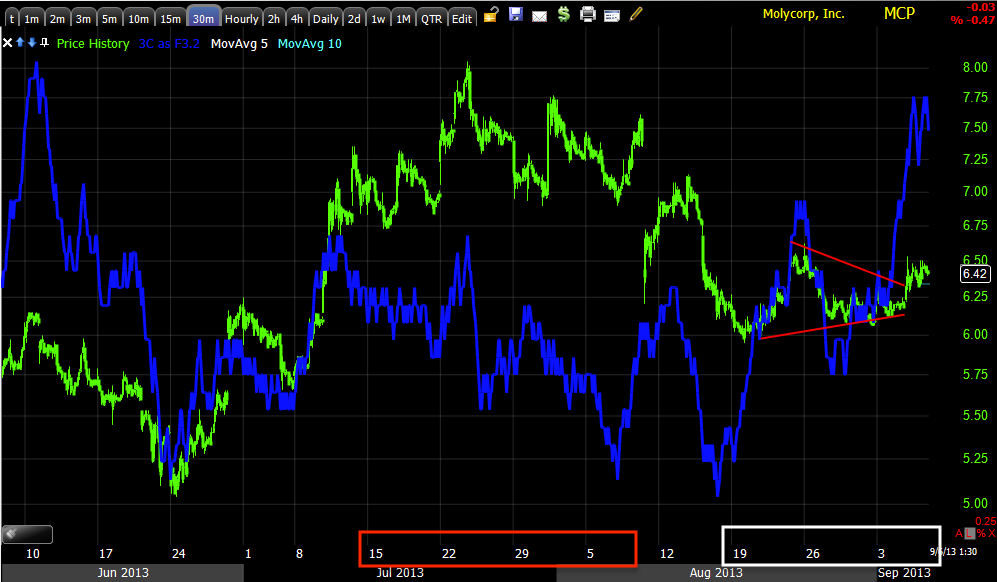
Above you see price pulling back since the 8/22 highs, which way is the 15 min 3C indicator (blue) going? OK, price down, 3C should be moving down in a normal situation, but 3C moving up means there's stronger and stronger accumulation of lower prices, someone is accumulating, someone big and they know something we don't, I'd rather follow them.
In yellow I have a "rough" price range for a pullback. With a triangle in place a pullback, to be effective and hit stops would have to at least move below the apex of the triangle around $6.25, ultimately though the market almost always moves much more extreme than needed and it's likely that the lows att the wide end of the triangle would be taken out to hit those wider stops, that's under $6 and $6 is a whole number where the human mind gravitates to. The point bewing, when a trader enters a position and thinks about a stop, they look at support (the triangle's apes) and figure a wide stop would be $6, they don't think $5.93, they think $6.
This is the reason every retail store uses $5.99, they don't want you thinking $6 because it "seems " to be more expensive than just that 1 penny. Our minds gravitate to whole numbers and as such, traders' stops do the same.

So, set some price alerts if you are interested, if you can pick up MCP below support on a stop run (volume will swell on the stops being hit) and as long as 3C is accumulating those stops, it may seem hard to buy in to a move down like that, but you are actually getting a much better price and much lower risk and considering we see a head fake move like a stop run 80% of the time before a reversal, you also have high probability timing.


No comments:
Post a Comment