I'll say it again because it is worth repeating, I'm not impressed by this market's internals/underlying trade at all. Yes, there has been afternoon improvement as envisioned Friday, but there are some horrible looking averages out there, one of the worst is the QQQ, I'll show it to you soon. If the entire market looked like the Q's, I'd be moving aggressively to tidy up short positions.
The USD/JPY is definitely an obvious market driver for upside, its divergences however are on 15-60 min charts which means they are strong, but it also means they are not in the area of an immediate reversal. There is some 1 min intraday $USDX 3C signals that are the best of the day, but those would still need to strengthen and hop over to the 5 min chart. It is interesting though that the 15/60 min charts look as good as they do, especially in light of Goldman's call to the contrary late last week.
For now, the VIX Futures are showing some signs of deterioration that may afford the market some wiggle room to the upside, I'm not suggesting an immediate launch to the upside, but as I said, the way they are moving allows the market some room above it. Whether TLT and HYG join to form the positive SPY Arbitrage is unknown, but the 30 year treasuries are bending toward that probability slowly as the day progresses.
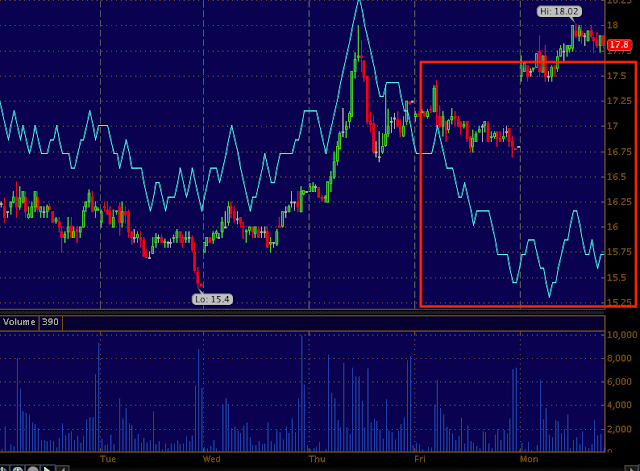
The 2x leveraged "Short Term VIX Futures", UVXY intraday 1 min chart is seeing more and more negative tone. Pay attention to the 3 different VIX assets, especially around the 5 min mark or thereabouts.
2 min Leading negative.
VXX is the non leveraged version of UVXY above, this is the 2 min which is very similar and fading intraday.
VXX 5 min, pay attention to the negative divegrence here and compare with the actual VIX Futures 5 min.
The 15 min chart had been where the trouble was with VIX Futures, as the short term charts start looking like the 15 min chart we know the probabilities are growing of a move to the downside.
The 15 min VIX Futures looking worse than Friday.
This is the 30 year Treasury Futures 15 min chart, this is very similar to TLT so this is the strongest negative in 5 days. The VIX and TLT moving down are market positive just as the $USD/JPY moving up is market positive.
Is interest rates about to start going up?
-
Yes, I know - it does not make any sense - FED is about to cut
rates...but....real world interest rates are not always what FED wants it
to be.
6 years ago


No comments:
Post a Comment