Long term I love UNG as a long term (Primary Trend long position) and as such, as core long position I always carry UNG long (+12% right now), but the expected pullback that was traded in the trading portfolio using DGAZ seems to have been hit by some fundamental surprises causing the market to discount the new information in the way of several unprecedented Polar Vortexes, I had never heard of them before this.
In any case, on the other side of the coin has been 2 CME margin hikes in the last week, the first an additional 20% margin and the second an additional 26% margin, which if you recall was part of what caused the 2011 gold market to top (CME margin Hikes), although these aren't as ferocious as the gold ones were, they still put downward pressure on prices.
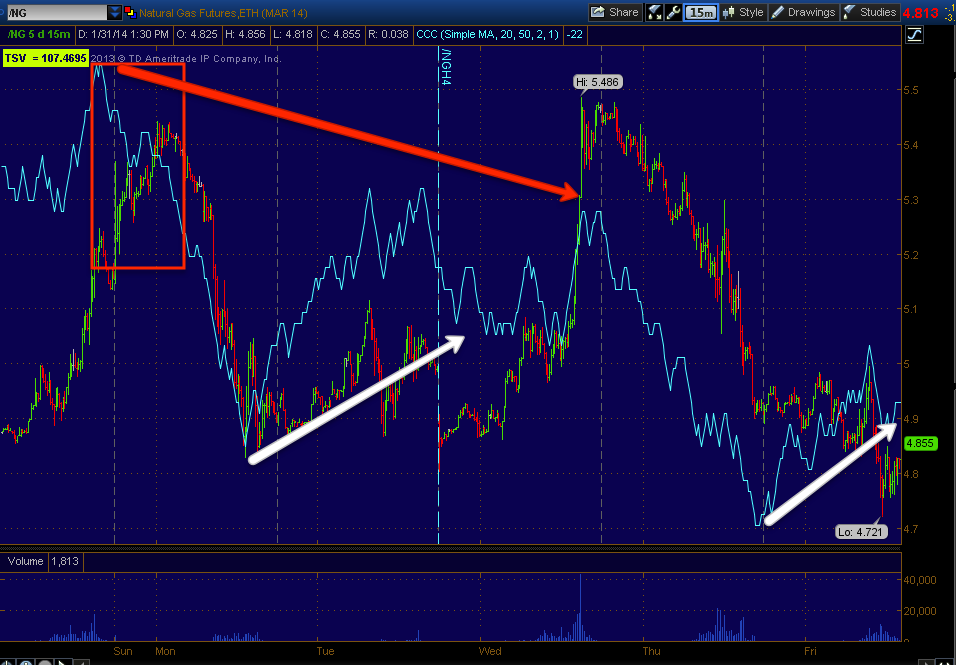
As far as the current charts... These are actual Natural Gas futures
60 min chart has a relative negative divegrence, not the strongest divergence type, but on a chart this long (60 mins), it's respectable. Furthermore there's a slight leading negative component just added recently.
The 15 min chart is very interesting because I have mentioned several times how the futures version of 3C (above) differes from the equities version in timeframes so the timeframes shouldn't be compared in the same manner. Look at the 3C divergence on the 15 min NG futures and next...
Note UNG, a totally different asset (the same idea-natural gas) has a 3 min chart that looks exactly the same. Both feature a larger negative divergence, but in to the decline from that divegrence, both show a smaller positive divegrence which looks like a normal corrective move to me, not a trend changer.
The intraday 1 min chart is a little sloppy, but again the main feature is a larger negative divegrence with a drop in price that is seeing a smaller positive divegrence, once again looking like a normal corrective move within a larger trend.
The Daily UNG chart with RSI is showing a negative divegrence as well currently, I bring this up because of the following charts.
This is the breakout in UNG we have waited for going on a year and a half so it's a strange position to be in, loving this stock as a long term play, but I'd like to see it come down in the very near term. Volume yesterday was quite large on a rejection of higher prices with the longer upper candle wick. Today's candle thus far makes sense with some of the intraday signals we are seeing as it is a hammer, a short term support candle.
Looking at a 5-day chart, it looks like the breakout is being tested as the most current candle is a long-legged Doji Star, the epitome of indecision and on huge volume, as a UNG long this is not a great candle to see, although I suspect it would be a temporary event to overcome, as a trading short in UNG, I'm glad to see it. Also as a long I'm glad to see it because I would like to add to the UNG core long trending position.
UNG 1 min is choppy like NG 1 min charts, but a recent weak positive divegrence along the lines of a corrective move in the recent down trend (of 2-days).
UNG 2 min shows the same theme, a larger negative divegrence and price moving down off it and what looks to be a corrective bounce, I would guess it wouldn't be able to go much further than the gap, in fact that may be resistance if it gets going.
The 3 min shows the same theme, a large negative divegrence and a smaller corrective positive.
DGAZ 10 mins shows the initial or original positive divegrence for the long trade that was run over by extreme weather events being discounted. The current signal is leading, if it adds a second stage on the upside of 3C right now, it will be a very strong signal.
This is the intraday DGAZ chart, it actually looks pretty good so I'm wondering if the intraday positive in UNG that looks to be corrective is actually going to be corrective or if it is just enough to cause a temporary lateral consolidation.
Still long DGAZ.
Is interest rates about to start going up?
-
Yes, I know - it does not make any sense - FED is about to cut
rates...but....real world interest rates are not always what FED wants it
to be.
6 years ago


No comments:
Post a Comment