
"A" is a variation on the head fake move called a Crazy Ivan shakeout which gives the head fake on the upside a little more momentum by running stops below the triangle and engaging some shorts before moving up and forcing the shorts to cover and those who were stopped out to buy back in creating stronger upside momentum, but the entire point is "C", to get above the triangle where retail will buy on "Breakout confirmation" or chasing.
Stops will usually be placed just inside the triangle, at the apex (point) of the triangle or just below or below the lower trendline of the triangle. As price rolls over and engages those stops it creates downside momentum the same way a bear trap creates upside momentum through a short squeeze, at some point on the way down shorts enter creating more momentum just as in the last move up longs enter creating more momentum, it's the EXACT SAME CONCEPT, JUST IN REVERSE."
That's exactly what was posted yesterday, when I said," a Crazy Ivan shakeout which gives the head fake on the upside a little more momentum by running stops below the triangle and engaging some shorts before moving up and forcing the shorts to cover and those who were stopped out to buy back in creating stronger upside momentum,"we actually saw that today , not only with the break below which looks like a failed bullish triangle, but as I mentioned several time today, there was a near perfect little bear flag created...
From today's SPY Triangle Update...
"however what is impressive is how cleanly it is bear flagging along the triangle's resistance trendline."

Again as a reminder, you have a bullish (as far as Technical Analysis rules go) continuation triangle, and as laid out yesterday, " a Crazy Ivan shakeout which gives the head fake on the upside a little more momentum by running stops below the triangle and engaging some shorts before moving up"
There is of course more to the entire scenario if you read the entire excerpt, what I did find strange was the schedule the market seemed to be on to get this done today, for instance...

Take a closer look...

And while the EOD volume appears to be large, it's nothing special at all, take a look...

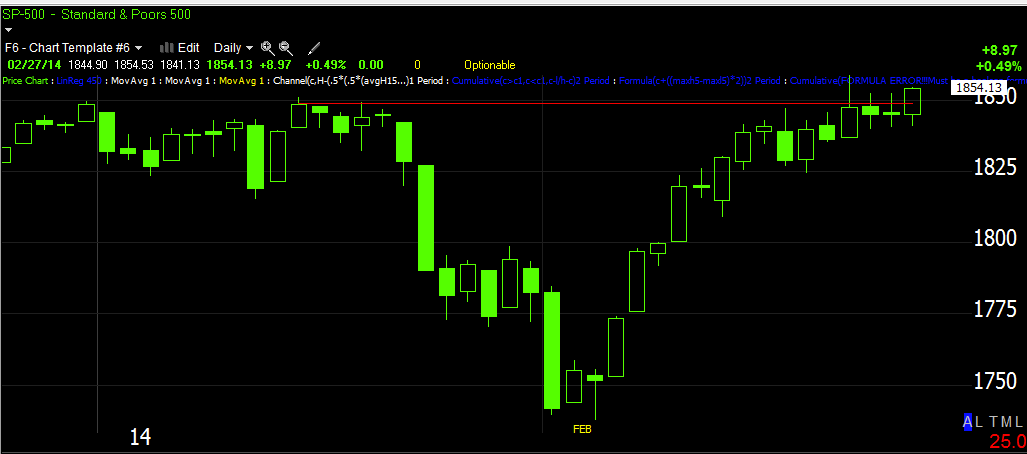
This is most of 2014.
I figured we were so close they'd hit that level, but I expected some more excitement, this seemed like a real job.
I don't know what the time schedule was about, perhaps it had something to do with the USD/JPY...


To get the job done they did break out what they needed to or were able to, such as HYG...


Still what we have left on a daily chart...
As shown earlier, sentiment hasn't bought this week (pro)...

Also seen earlier in Leading indicators other than TLT outperforming the SPX correlation, VXX (short term VIX futures) were outperforming as well.


Tonight's Dominant Price Volume Relationship was among all 4 major averages, 14 of the Dow 30, 55 of the NDX-100, 618 of the R2K and 220 of the S&P 500, the relationship was Close Up/Volume Down which is the most bearish of the 4 possible combinations and usually acts as a 1-day overbought condition with the next day closing lower.
We do have an op-ex Friday to contend with tomorrow.
As for futures, I don't put a lot of faith in 1 min charts overnight for Index futures, but I thought I'd show them just because a couple of them are so extreme and maybe check up on them a bit later.

It will be interesting to see if these amount to anything.


I'll check in in a bit if Futures are looking interesting.


No comments:
Post a Comment