The head fake move I have been expecting hasn't materialized yet, but there are some signs it may be about to.
Leading Indicators have improved quite a bit through the week, there are some very impressive signals and the USD and JPY are on track for taking the carry trade down and Index futures with it, I'm going to try to fit as much as I can so I can get to other things.
QQQ
3 min Leading negative

5 min leading negative
10 min charts are putting in deeper leading negatives, some where there was none, see yesterday's 3C lows vs today's.
QQQ 30 min, this is where the probabilities have always been, it's almost like a guarantee that prices are coming down with these longer timeframe divergences, they expose the underlying trend without all the noise of intraday moves.
SPY
SPY 10 min leading negative mentioned earlier, quite a bit of downside on this timeframe today, rather impressive.
SPY 3 min with Monday's positive divegrence we saw.
A closer look intraday at the 3 min chart has a small positive relative divegrence and a very flat, obvious resistance area, this is the area I thought we'd se taken out by about now with a negative divergence in to a head fake move, acting as a timing flag.
I'm guessing this is still the scenario.
IWM
3 min , it's important to compare to relative areas in the recent past like highs. pivots, etc.
5 min leading negative, you can see what's left to the far left of the Jan 27 to Feb 5th accumulation zone, a massive hitch-hiking position like we do.
IWM 15 min, worse than the 10 min leading negatives.
IWM 60 min, again this is the underlying trend, forget day to day, this is telling us what happened during that move up, it is exactly as we suspected before the move up started, in fact the move up was a means to kick start the next larger trend down and the chart above was a way to confirm we were on target with that analysis,
all before February 6th.
Again the 3 min intraday IWM looks like a relative positive and a VERY clear line of resistance, that's where I expected a head fake move to take place by now and that acts as a timing flag, also an area where I'd likely be adding to any positions I'm still looking in to.
This is what the market has needed though, I've talked to several people today about FAZ as a long, what I said in all cases is "It's not the divergence that I'm concerned about in entering now (this morning), it's the reversal process, FAZ needs some lateral time to put in a reversal process and allow 1-5 min charts to strengthen and that's what today has done so far for a position like FAZ (3x short financials)...
It's the yellow arrow rounding or reversal process that wasn't there earlier and is now showing up a lot better, otherwise we would have had a very unlikely "V" reversal, this was part of what told me we needed some more time today.
$USDX
The 5 min $USDX continues to lead negative, if the $USD falls and Yen gains, the USD/JPY falls and you've seen the correlation between the market and the FX carry trade, it's 1.0 so this chart is essentially a market negative chart.
Yen
Last night in the Daily Wrap I said the Yen needs some time (even though it was putting together a positive divegrence) to form a reversal process and I thought it would be ready today, it looks pretty darn mature, and it's positive, again Yen up, USD down is a market negative via the USD/JPY.
VIX futures...
5 min leading positive VIX futures with a nice mature rounding process, they trade opposite the market, it's interesting that a lot of these futures 5 min charts are on the same page.
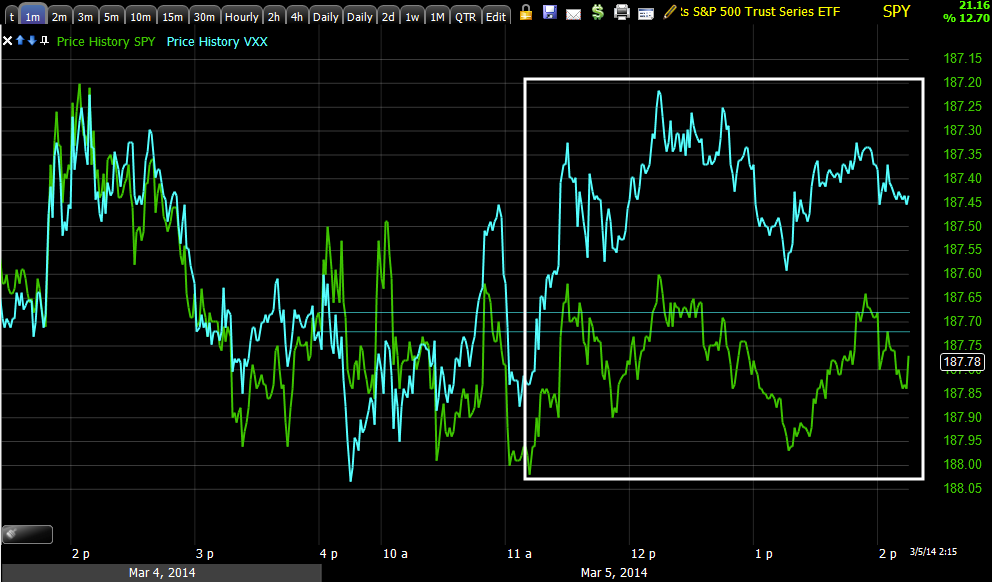
Leading Indicators, VXX
I have inverted the SPX's price (green) so the correlation between VXX and SPX can be seen, once again VIX short term futures are outperforming the correlation, apparently demand for protection and this is in fairly large size at this point.
VXX / UVXY 2 min
3 min with nice migration
5 min
And the large position mentioned in an hourly chart.
Short term this looks similar to the averages 3 min charts for a head fake move.
HYG High Yield Corp. Credit
This is the asset used as a lever to ramp the market, the intraday chart shows distribution, I think HYG is all used up to ramp and support the market.
A longer view shows the same on a more serious note.
This is the intraday trend of HYG, distribution as can be seen in price action.
However this is the real important chart, HYG was accumulated enough to help move the market, but that has turned in to deep distribution, the position has been abandoned so I doubt it will be seen in late day ramps or even average ordinary daily moves as a lever of manipulation, apparently they aren't willing to take the risk holding HYG any longer.
If I could find a decent April Put here and get an intraday bounce, I'd consider HYG for a Put position, as an equity short I don't like the beta, a little low for me.
FCT-pro sentiment...
This is one of two we use, this tends to show the longer term or larger play among pros, they have not been willing to chase this rally, in fact they are going the other way.
Our second Pro sentiment indicator, but this one on a near term basis...
HIO has quite obviously fallen out of bed with the SPX (green), this doesn't look good for the market near term, the chart above doesn't look good for the market longer term.
And of course one of my favorite leading indicators as it is so accurate in calling pivots, it called all 3 on this chart (well the 3rd is waiting) and the 3rd is by far the worst, this has been one of my favorites for a good year or more.


No comments:
Post a Comment