It's another fairly blah market in breadth and some underlying trade although price is not as blah with all of the majors in the red by at least half a percent to nearly 1% (.90-ish) (
at the time of starting this post).
Here's what things look like so far, not really exciting, but some insights.
ES intraday had a 1 min positive at the early lows right after the open, it couldn't capitalize off it much at all and now we are close to in line again.
The NASDAQ 100 futures 1 min had the same divergence right after the open, there's a small leading positive to the far right, I think this has more to do with AAPL than anything else at this point.
Russell 2000 Futures going negative several times overnight, but largely in line with the losses and still in line right now,
no positive activity at all unlike NQ futures above.

This is the 5 min VIX Futures I mentioned earlier this morning, note the positive divegrence started as the VIX was initially slammed lower at regular hours open and continued to move higher,
these do not trade 24 hours, only a few minutes out of normal market hours so most of this divergence is regular hours.
This is today's NYSE TICK Data, it's almost trendless, except "Lateral" or sideways is a trend and it's in the +/-750 region the entire morning, nothing of any significant breadth, a little wider than parts of yesterday, but no huge moves in breadth.
My custom TICK Indicator shows the same, you see yesterday's move up and then the decline in breadth as we also saw negative divergences in the averages in the same area and positives in VIX futures.
SPY 1 min going negative in the afternoon as I mentioned above as well as the early a.m. positive today that went no where and right now totally in line with price.
The SPY 2 min shows another cycle I didn't mention earlier, it's a much smaller one, buy obvious as the chart leads negative and looks to be rolling over which could kick start the smaller cycle posted earlier today and the larger February cycle's transition BACK to stage 4 as every average entered it before a VT shakeout.
SPY 60 min w/ the Feb. cycle leading negative, the red "4" is stage 4, the yellow arrow is the volatility shakeout we always see right after a move to stage 4, we see it a lot in H&S tops as well as clear stage 3 ranges like this one.
The pivot to the downside would be returning to stage 4 and thus should make a lower low, not just a pullback and for the NDX/QQQ, that would be significant.
IWM intraday, it looks just like the IWM futures, in line with the move down.
IWM 2 min has some divergences in the trend, but the theme is in line
The QQQ is nearly perfectly in line right now intraday , similar to the NDX futures, except they were moving positive and since have moved more in that direction, again I think this is the reason.
AAPL intraday with a lot of inline activity, but a current positive divegrence
intraday only, the trend view is located in a leading negative position.
Remember this is one that should come to us.
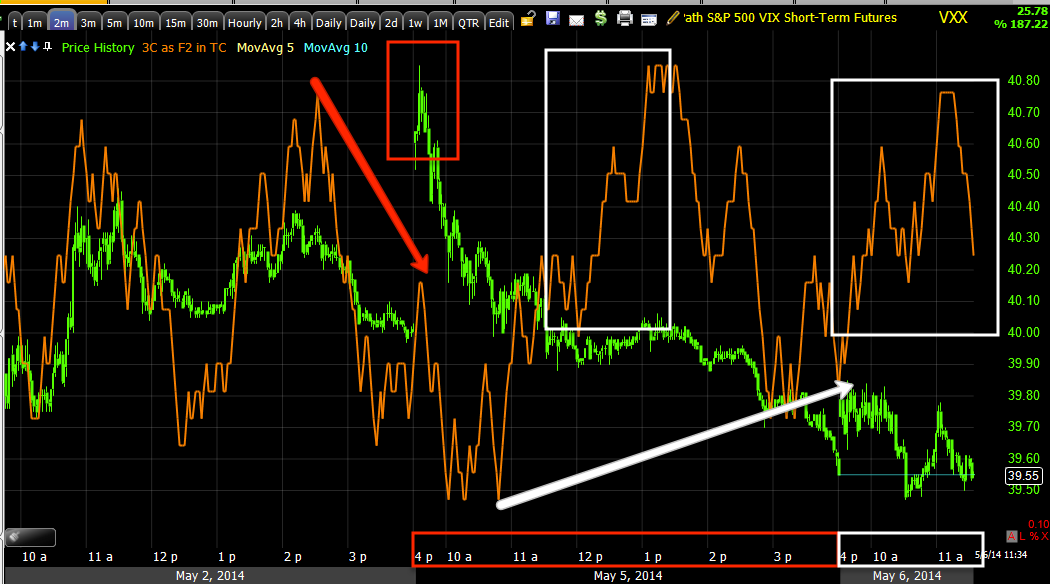
VXX 2 min from the initial distribution on the open yesterday to slam the VIX to the accumulation of lower prices.
This is the USD/JPY which ES has been tracking very well
And the EUR/JPY which ES has also been tracking fairly well
USD/HPY 1 min (red/green) vs ES (purple), you can see the tight correlation.
I suspected that the USD/JPY would head higher because of this $USDX positive divegrence
The Euro has a negative that was in place since earlier so I'm not feeling strongly about that right now.
However, when I had that impression of the USD/JPY heading higher with the $USD positive divergence, the Yen had a negative divegrence at the time that made sense, it has since resolved to in line with a 3C move higher, it's hard to say now because a rising Yen keeps the USD/JPY moving lower and a rising $USD moves the USD/JPY higher and right now they are both at odds, that may be why there's such stale activity.


No comments:
Post a Comment