We'll get back to FXP shortly, for the time though, FXI was expected to start seeing some downside as of yesterday's analysis,
FXI Charts. Because of the set-up in FXI, I chose a put position yesterday rather than an equity position,
Trade Idea: FXI June (monthly) Put *Speculative.
So far this morning the position is in pretty good shape with a +16% gain so far. As of right now, I have no intention of closing the June (monthly) put position.
The 1 min chart is probably most important in my decision to continue to hold the FXI put,
I typically want to be out of the position before the first bounce or retracement, even if I expect more downside. I'd rather just re-enter the position after the retracement or correction is over, however on this chart there are no signs of that correction coming any time VERY soon.
The 2 min chart is also helpful in the decision as to when to take gains or get out of the way, it is pointing to probabilities of lower prices intraday.
As is the 3 min chart which was negative yesterday, but has added to that leading negative significantly today.
The 10 min chart tells me that if I do exit the FXI put, I'll probably want to re-enter a put/short as the near term probabilities are for more downside.
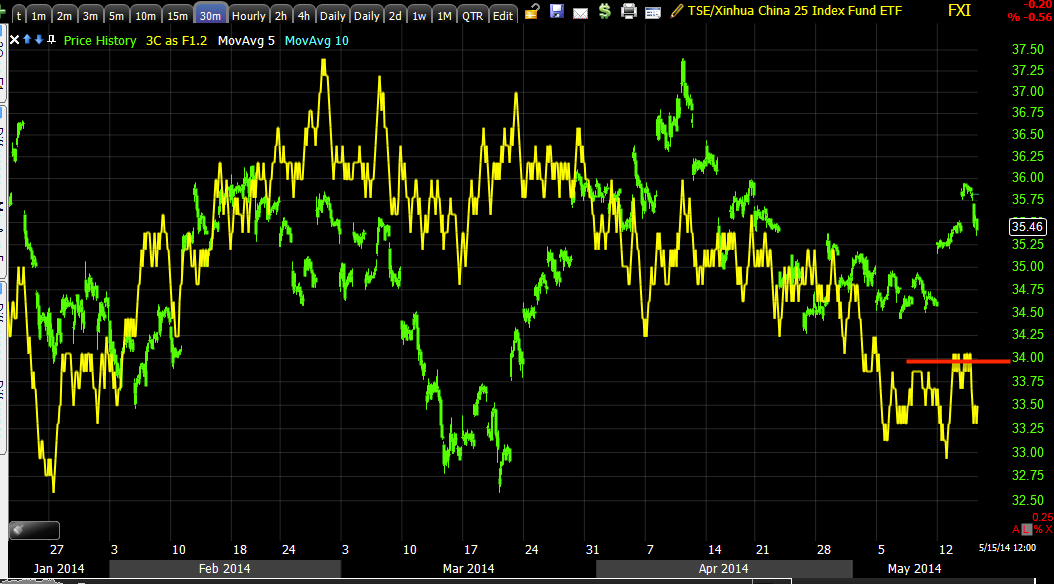
The 30 min chart tells me the same. Although 3C doesn't point to any specific target, I;d expect a move to at least $34 before any significant correction.


 | Theme by Thur
No comments:
Post a Comment