Since we have a little time intraday for a reversal process to form, I thought I'd put this update out.
I like to try to update these for you once in a while, especially since we just saw a major shift in signals from stage 3 of the February cycle which has ended in the NASDAQ 100, but is still alive in the other averages in which we had good signals, but not complete, thus there have been very few trade ideas the last 2 months,
however it appears the 3C signals were correct and being patient was a wise choice as we would have been caught in this...
These are what I consider to be "Tradable Trends" and we usually have very good signals for these trends, at least up and down, however "lateral" is just chop, it's VERY difficult to trade, I often call it a "Portfolio Meat Grinder". In my view, lateral trends are good for writing options and that's about it.
As for the SPY signals, you should notice a very distinct , recent change from bad, to VERY bad...
SPY 1 min , and the time we have intraday right now.
SPY 2 min...Note the distinctive change in 3C character, especially after the USD/JPY move above $102 Monday this week.
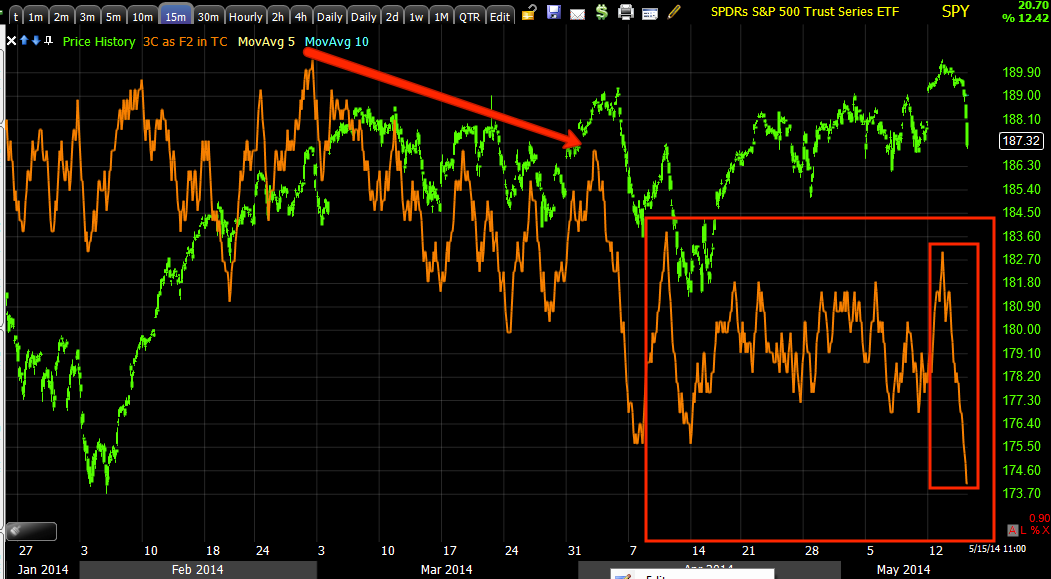
SPY 5 min, again the reason I have been waiting is for all signals to line up at the same time, over the last month-plus, different timeframes have been negative at different times in the 1-5 min area, the longer have remained negative, telling me that the probabilities favor the shorter timeframes falling in to lock step with the longer ones and the market being in serious trouble.
Since the Feb. 3rd Cycle, the market has just fallen apart, it was actually looking very bad in to the Feb 3rd cycle, specifically right around Q4 2013 Window Dressing, then Jan. 28th we started seeing accumulation in to Feb. 3rd and just past when the up move we were expecting began, it was a bit stronger or at least longer lasting than I had anticipated,but the stage 3 top moved to stage 4 and then the typical shakeout as 3C continued to deteriorate.
15 min SPY
Note the very recent deterioration, it has been very fast migration of a leading negative divegrence that started almost exactly after USD/JPY broke above $102 this Monday, something we had seen the previous week as being VERY high probability based on the Yen/$USD signals.
It seems that psychological magnet of $102 was used to sell/short the market very hard.
SPY 30 min
SPY 60 min
And the longer trend with less signals, but less noise as well, the 4 hour chart.
As for the major underlying action through the F_E_D's QE program...
This is the SPY 5-day chart, that's by far the worst divergence (or strongest) either negative or positive we have seen since before the 2000 Tech bubble. In fact, I can't find anything even remotely close as far back as my history on the chart goes back and that's to 1992. The Dow's divegrence is worse than the 1929 crash.
Speaking of the Dow, I picked a few select charts from each of the other averages like this DIA 15 min to show the deterioration, especially recently.
IWM 4 hour.
And this QQQ trend is a flag or counter trend bounce, I highlighted volume at key areas like capitulation, head fake /false breakout above our target range and the typical diminishing volume of a flag or counter trend rally. Now look at the 3C signals during the same period.
QQQ 30 min, look specifically at the counter trend rally or flag area and what smart money is doing with any chance they get at higher prices.


No comments:
Post a Comment