Last Friday, I expected we'd see some kind of move above the range because it's so large, so obvious and I suspected we'd see something like the last candlestick reversal that was a failed breakout above the range...From last Friday,
A Few Broken Levers
"In any case, the candlestick pattern (and I'm forecasting this based on the condition of the charts and levers available) would look like the chart posted already,...
That's a common candlestick reversal pattern."
A few variations on the pattern included a Shooting Star, A Hanging Man, an Evening Star, or some kind of Star/Doji (bearish reversal candlestick patterns).
we're not at the close yet, but we have quite a few of these candlestick patterns mentioned Friday as probable candlesticks showing up early this week (considering the holiday).
The DIA put in a Doji Star yesterday and a Hanging Man thus far today on increasing volume which makes the reversal patterns that much more effective if volume is higher than the preceding day.
The NASDAQ Composite has a Doji inside yesterday's candle, an inside day or a Harami Reversal thus far.
The QQQ has something similar, volume is still a bit low.
The IWM also has a Hanging man-type candle inside yesterday's body, a Harami or inside day.
And the SPX has a hanging man reversal candle thus far on the daily chart today.
As far as leading indicators, I'll have to get the more liquid version of HY Credit after the close, but High Yield below...
Continues to deteriorate vs the SPx.
Bonds continue to rally despite the 180 degree correlation vs the SPX as you see TLT doing here.
VIX continues to be strong despite the market with another (at least the 3rd in a row) green day thus far.
This is VIX vs SPY with SPY prices inverted so you can see the correlation that would normally exist, VIX is way outperforming the correlation.
Pro Sentiment has falen off the chart vs SPX, they aren't chasing, in fact the opposite.
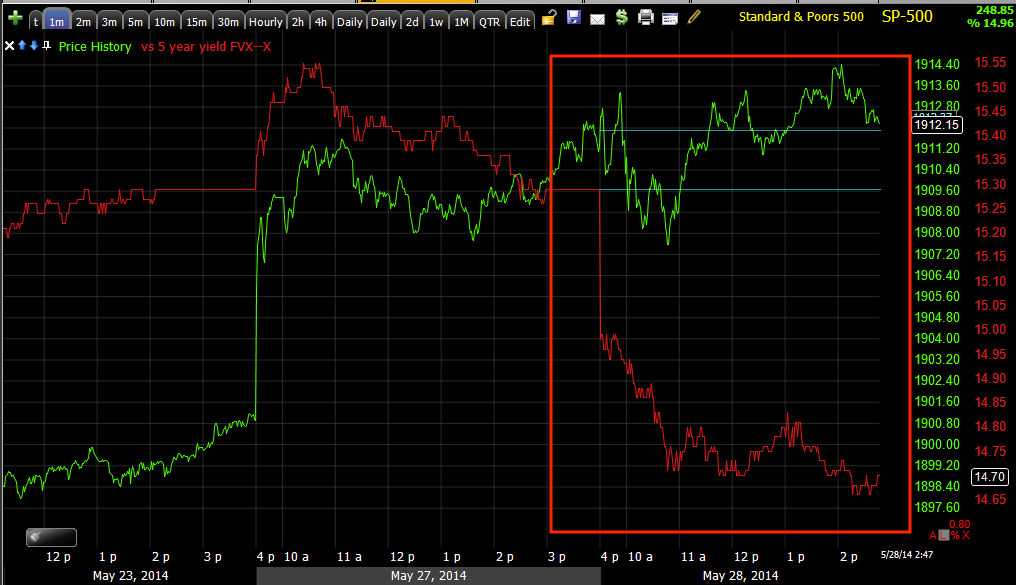
Yields continue to lead the market in a downward/bearish dislocation.
The longer term Yields look like...
This which is a fairly large top-type dislocation as this is one of my favorite Leading Indicators.
We'll see how volume closes, the higher the better. The 3rd candle in a candlestick reversal pattern would be a bearish candle tomorrow, like an engulfing.


No comments:
Post a Comment