It seems like we are in a holding pattern right now, it's a bit volatile, but still feels like a holding pattern and there are plenty of negative indications, the Index futures though moving so fast surprised me as I wouldn't normally look out that far because they don't usually move that fast. Perhaps the holding pattern has to do with tomorrow morning's Non-Farm Payrolls, perhaps closing trade, I'm not sure, but it's a tough market at this particular moment because of the chop that has dominated, which is like a meat grinder for those who are over-trading, this is why I've really been staying on the cautious side, but there's something definitely going on here.
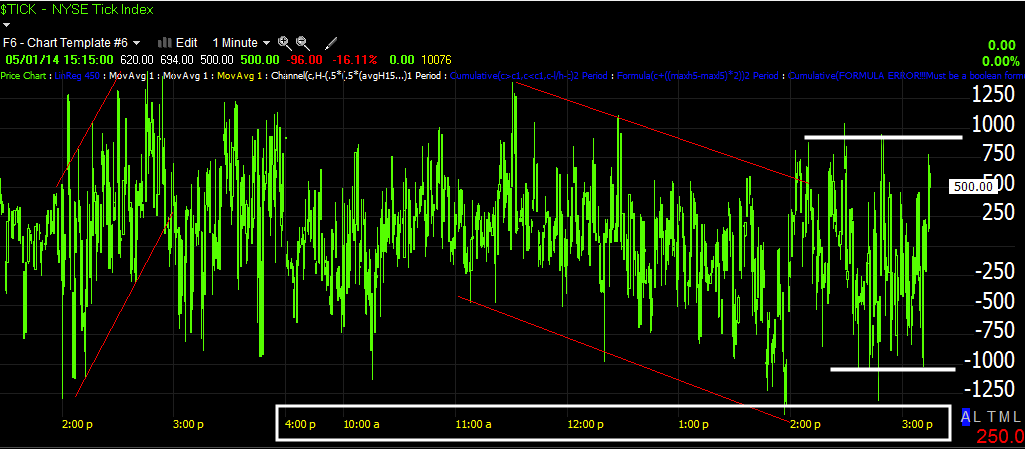
As for the holding pattern and volatility (remember volatility increases right before transitions from one stage to another), the intraday NYSE TICK is a perfect way to view it.
In white is today's regular hours, note the initial pump and then decline and now this wide lateral trend at +/-1000 which is pretty volatile.
Take a look at several charts.
The SPY 1 min trend has been telling us something has been going on, that something seemed to make its presence known more clearly right after the close in Index futures and on a day like today (May Day) with light volume, the machines should be able to move this market anywhere they want.
This 2 min chart in the SPY shows fairly dramatic deterioration
This 10 min chart shows the start of the volatility shakeout we expected as of April 11th as I posted earlier today, you can see the accumulation for it and it's clearly fading off as the timeframe is leading negative nearly in a vertical drop.
This is the entire February cycle that is causing a lot of the moves, volatility shakeouts, transitions from stages (3 to 4) , etc, but the underlying trend here on a 60 min chart is pretty darn clear.
I put the stage 3 area in yellow (there's a break to 4 below it) and just want to point out the meat grinder this market has been, this is the reason I've been cautious about trades, if you're not careful, this will chew up a portfolio faster than anything and it's not that wide of a range so it's hard to get much of a move beyond a few days in most assets.
I suspect that's getting ready to change though as we saw in last night's update, the HYG update, the futures update and intraday action today.
QQQ 1 min intraday from negative to a small positive, but this is only 1 min, it's more or less just steering intraday trade and that's what looks like a holding pattern for the moment.
There's no negative on the QQQ 2 min chart, that means the 1 min negative has about a 50/50 chance of either producing an intraday bounce or holding a lateral consolidation as the TICK data shows,
if the 2 and /or 3 min charts joined the 1 min, the probabilities soar to an intraday bounce.
QQQ 3 min deterioration has been evident, I'm not sure if I posted it last night in the Daily Wrap, I meant to and may have.
And the 5 and 10 min charts are very similar, the fact that there's migration from these 3 timeframes is also an important feature.
The 10 min which largely shows the QQQ downtrend that retraced almost all of the February rally unlike any of the other averages shows that it was in line of price/3C trend confirmation on the way down which is bearish for the Q's and even the April 11th/15th bounce we expected (the one I posted the targets from April 11th earlier today) has run its course and is leading negative once again.
The IWM trend on an intraday chart is also showing confirmation of the downtrend, the very recent activity has remained in a leading negative position.
Here's a close up of the IWM intraday 1 min with that same intraday positive or holding pattern.
The 2 min is nearly exactly in line so there's no positive there like the Q's.
The larger 15 min trend also shows nearly perfect downside trend confirmation in 3C.
Note the lack of any positive divgerence.
And this is the 60 min IWM with the 4 stages of the April rally from #1/accumulation/base to #2 mark up or rally to #3 top/distribution and a break to stage 4, almost the entire trend from mid to late stage 2 has been in a leading negative divegrence,
this is where the probabilities for movement are and with Index futures moving so quickly, it seems like they are acting as a timing mechanism.


No comments:
Post a Comment