And that's the one, I checked all of the other "Usual Suspects",
This is a 1 min chart of the USD/JPY pair in green/red candlesticks and ES (SPX E-Mini Futures) in purple, so the tall spike about 23rd's across the chart around $101.84 is around the open of regular hours today, to the far right is current price (at the time of capture a few mins ago).
As you can see, the correlation is not perfect, but it's the one.
Take a look at the same comparative analysis on a longer 5 min chart.
Here ES runs up yesterday (red box) above the ALGO sanctioned correlation and it gets promptly...? You saw the charts of yesterday's highs, it gets distributed, I'm not sure if Yellen said something yesterday or what caused ES to run north of the FX carry trade, but the algos made short work of the arbitrage opportunity. Otherwise, the correlation is pretty darn tight. Thus making USD/JPY, still the pair of greatest interest and the most likely asset to move the market in the near term, in the mid to long term, the distribution trend is the most likely driver of price.
This is a 1 min intraday chart of USD/JPY, unfortunately with FX pairs, the 3C signals are usually only good on the a min and sometimes 5 min charts, after that they're useless so I look at single currency futures of the components, $USD and JPY (Yen).
We see negative divergence signals today and this is one of the reasons I put out a quick note that we'd likely see some downside, but this is just intraday stuff.
This is the Yen intraday in line, so what's moving the pair lower?
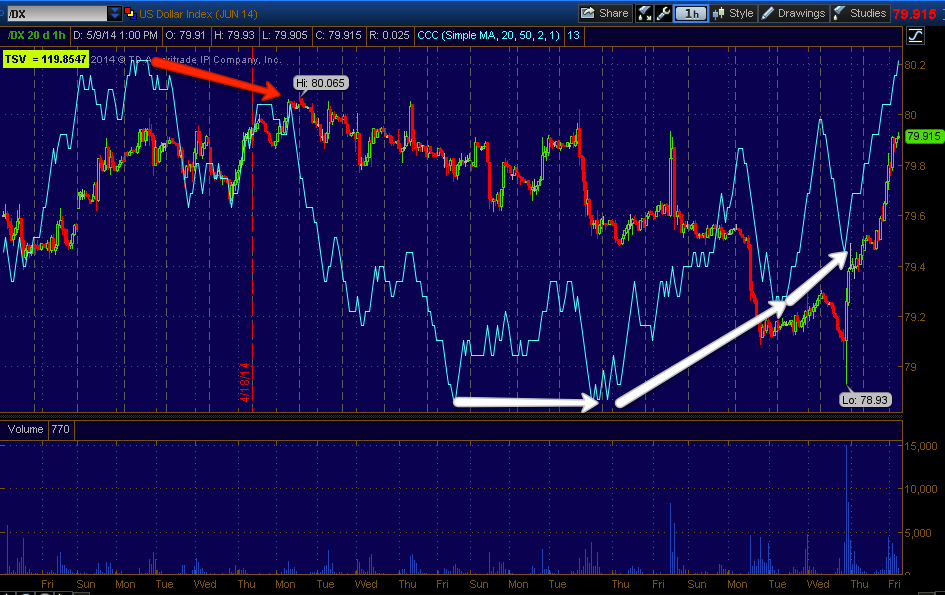
The $USDX has a nice leading negative divegrence and that should move the pair and Index futures a bit lower, depending on how long it takes to fire, it looks ready to turn soon.
The 5 min Yen has had a negative divegrence for the last 2 days, that fired and turned the Yen down which helped USD/JPY on the upside a bit, but this signal is just in line right now.
It's the 5 min $USDX that looks bad and is likely to cause the USD/JPY to fall, that should take the market down with it, but I'm talking about "pullback", at least at this point.
During a pullback we'll see if there's accumulation or not and that will tell us if USD/JPY is building a bigger base, if so, then $102 will likely be taken out and the market moves up with it, that's what I want to short in to.
If not, then we are likely to transition from stage 3 and these different areas of stage 4 to a normal stage 4 decline and I think this is the one that brings the SPX and Dow down below the Feb lows and the QQQ to a new lower low as it already retraced the Feb. lows.
I've covered this a dozen times now, this 15 min leading negative divergence of the Yen is the BEST hope for the USD/JPY to bounce above the important psychological level of $102 where all the stops and action is, that would move the market up on a bounce and that's what I'd want to short in to because this is as far as the Yen negatives go, the 30 min chart is in line.
As for the $USDX, it doesn't get positive like that (USD up and Yen down = market up) until the 60 min chart.
However as recently noted, the long standing $USD Legacy Arbitrage correlation is a strong dollar=weak stock prices, weak precious metal prices, weak oil prices, commodities, etc and a weak dollar is the opposite. This is a decades long correlation that we haven't really seen since the F_E_D started destroying the $USD via printing/Quantitative easing, but as they dial back the Treasury purchases and wind down QE3, it seems we are seeing hints of the old Legacy correlation so that's something to pay attention to, if it becomes reliable, if you know what the $USD is likely to do, you have a handful of assets you know which way to trade and vice versa.
Volatility was Monkey Hammered on Monday to lift the market, however, from what I've seen I think Wall St. knows where we are and where we are going better than anyone and it looks to me that they've been pinning the VIX futures at low prices to accumulate on the cheap, their positions are much larger than ours, they don't get filled in an order or a day.
The VIX futures 5 min chart has been leading positive, there's a slight relative negative, I think that reflects the positives I showed earlier today in the market averages as the VIX trades opposite the market.
However the VIX futures divergence has migrated to a stronger 15 min chart (meaning the accumulation process is stronger). It seems someone is afraid of something and are collecting VIX futures in anticipation of that downside event.
This is the 15 min VIX futures, I'll try to update the VXX / UVXY charts if I get a chance, but these last 2 hours of the market are when I gather a lot of very useful data so I'll be paying attention to the signals in the market across a wide range of assets.
Is interest rates about to start going up?
-
Yes, I know - it does not make any sense - FED is about to cut
rates...but....real world interest rates are not always what FED wants it
to be.
6 years ago


No comments:
Post a Comment