This morning's open with a quick retrace of overnight losses is actually not all that difficult to understand, I think one of the things that is most difficult for traders to comprehend about the market is that it's not a fair game, it's not a rational game, it's a rigged game. When you look at the market from the point of view of a hustler or a criminal who has all of the advantages, it becomes much easier to understand, you can throw out all of those Technical Analysis books because even if they can correctly identify price action that can forecast future movements, they don't understand the psychology of the market. Of a hundred-plus stock market books I've read, I haven't seen one, except maybe "Trader's Manifesto" by Don Worden, that even come close to addressing what really moves markets, instead they focus on whatever new technical trading system they are trying to push so you buy the book. By the way, I've used StockFinder's backscanner to test every trading system I can remember as I would prefer "system's trading" and take myself and my emotions out of the equation, but every single one pushed in these books failed over a full market cycle (they may have performed well in one environment, but then utterly failed in the next). In fact, the only automated trading system I found (actually created) is one that only trades 1 -2 times a year, it has spectacular results, but huge drawdown periods and the bottom line is no one has the emotional fortitude to go through that without stepping in and thus ruining the system.
I'm not talking about "beating the market", that can be done, my trading portfolio opened in March to test the waters for funding my accounts (make sure I can do both without sacrificing anything to either the website or my account) is beating the market easily. What I'm talking about is "Systems Trading" ability to beat the market, it's not there which simply means you have to think for yourself, you have to do the work, there's no easy way by following moving averages or indicators alone which is what I think the attraction to Technical Analysis is all about, laziness.
In any case, with this morning's quick gap fill, think about it from a simple emotional standpoint, you wake up, see futures in the red fairly deeply after Bullard's comments yesterday, most people don't have any idea that Japan and the USD/JPY was a big part of causing the futures to fall, they just see fear and we all paint pictures of "What's going to happen next", for instance when the market opens and those pictures we paint in our minds are scarier than anything anyone can tell us so it's not uncommon for traders to get scared and unload positions in pre-market, fearing a collapse in the market on the open. Someone has to absorb those shares, it's not likely to be other fearful retail traders, so if you are a pro, picking up shares on the cheap, it's a gift, what are you going to do with it to start your day?

ES/SPX futures shows pre-market dumping of shares and someone is accumulating those on the cheap, on the open where there's some real liquidity, they run the market up and cash in for a nice trade in the morning to start the day. You have to get away from looking at the market as moving averages and indicators and look at it as emotion and how the criminal element (pros) capitalize on that, then the market's true nature becomes much easier to understand, predict and follow.
As far as the Flag-like price pattern of the last 2-days, it hasn't given us much to understand it with other than the fact it looks like Wall St. set up a small cycle that was meant to be a bear flag and Bullard's comments about the "Market being wrong, the F_E_D is a lot closer to tightening due to inflation" distorted that flag in my view. However we are getting some indications now, of course this is all short term stuff, the chart posted last night is probably the most important chart I can think of right now (when understood in the context of the post I put up a week ago,
10-Year Yield (Bemchmark) vs. the Market and linked in last night's post, the implications are very simple and very reliable).
As for the flag...
The SPY looks like 2 distinct flags, they would be bear flags because they consolidate against the preceding trend, I think Bullard's comments are what distorts these in to 2 individual flags rather than 1 larger one.
The Q's are a bit closer to what I think was intended, Bullard's comments are one of those things the market can't discount because it didn't know about it, that's when we get price deviating from Wall St.'s set-ups. Even volume gives the appearance of a flag.
As for the charts... there's clear deterioration setting in now.
SPY 1 min on the open this morning going negative in to the attempted gap fill which would simply be the shares picked up in pre-market being sold at higher prices.
However the longer term 2 min trend went from the very dull, in line (green arrow) to what is looking like increased distribution, still flags are tricky the more obvious they become as they are head faked often as traders expect a certain outcome from a bear flag ( a break to the downside).
SPY 3 min is confirming the above as well, I'm not quite sold that this is the start of an imminent break to the downside, but it appears whoever got this flag rolling is taking the opportunity to let go of shares at higher prices or short in to them which would be what I'd want to do after Bullard's comments, you don't want the train leaving the station before you've had a chance to buy your ticket.
QQQ intraday this a.m. showing the same thing as the SPY.
2 min showing the same weakness building in which was not easily seen the first day and a half or so, I suppose that's because there's no point in distributing in to prices that are not yet higher.
QQQ 3 min with additional confirmation.
And QQQ 10 min with the highest probability outcome, despite any potential head fake moves on the flag-like pattern.
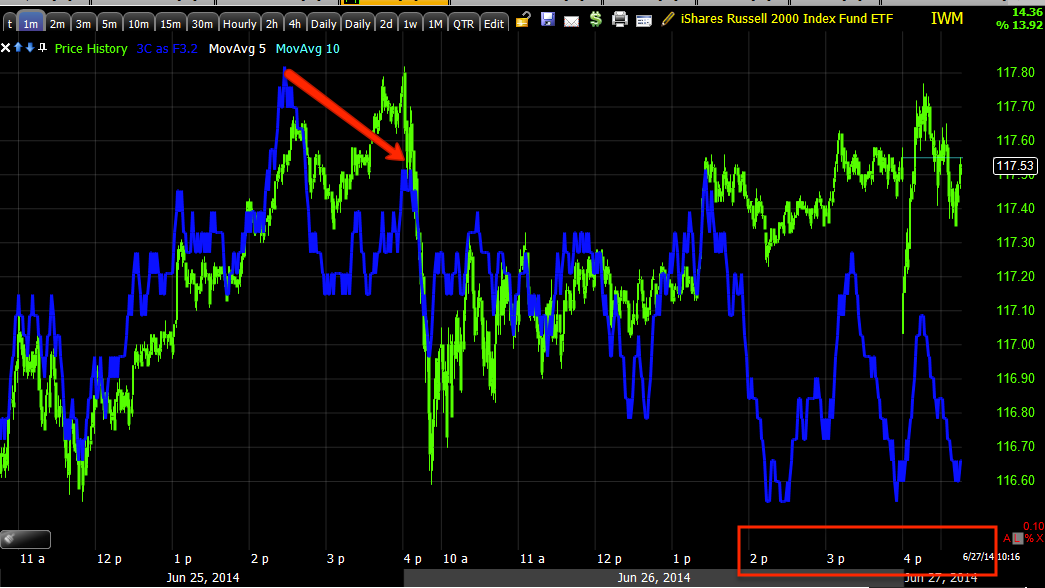
IWM 1 min, which looks worse than the others, I'm actually quite satisfied in picking up SRTY rather than SQQQ as initially planned; not that I don't like SQQQ, I just think SRTY has more immediate potential.
IWM 2 min showing the start of the flag with some minor accumulation and negative divegrences as it reaches higher.
The 5 min chart is where I start to take it more seriously and we have a negative divergence there, it's not a screamer, but it is a lot better than the confirmation signals of the first and second day of the flag when there were few signals.
The 15 min chart shows the highest probability resolution of this price pattern of all the charts above, it also shows there's nothing even close to confirmation here so this wasn't a strong flag created and...
The 60 min chart is just moving down further and further, this is the bigger picture highest probability resolution of price.
I have some interesting charts for PCLN which is also in a flag, I'll get those out ASAP, it also happens to be a H&S top near the right shoulder.


No comments:
Post a Comment