This is one that I've been interested in for a while and surprisingly, this is one that I get a huge amount of emails about and most are about shorting it, it seems there are a lot of people who don't care for PCLN or perhaps have an axe to grind, just be careful that you are not revenge trading or entering a position because you lost money there and you want to get it back there, that's just ego. If you want to make money back, find the best opportunity, it doesn't matter if it's the stock you lost it in, but so many times (we often don't even realize we are doing it), we try to make money back in the same asset we lost it in, that has to do with not wanting to be wrong, beating the stock in the end and being right.
This is one of the reasons there's a Wall Street maxim/question that asks, "Do you want to be right or do you want to make money?" The question sounds contradictory until you look at it in the light of a scenario like revenge trading as described above. The fact it's such a well known saying in the markets just goes to show how pervasive the effect is.
Charts...
Here's PCLN over a 2 year period, we have a stage 1 base, stage 2 mark-up (this is where the easy money is made, stage 4 decline which I believe we are very close to, if not already in when looking at averages like the Russell 2000, is actually an easier area to make money a lot faster as fear is stronger than greed and markets fall much faster than they climb. Both stage 2 and stage 4 are trending stages while 1 and 3 are lateral base and top stages) and stage 3 top. a H&S top MUST come after a preceding uptrend, typically the longer the better.
Also note the volume rising in the area of the H&S top, and recall how many of these price patterns are out there right now and all right at the top of the right shoulder much like the Russell 2000 which is the average that is considered the market leader.
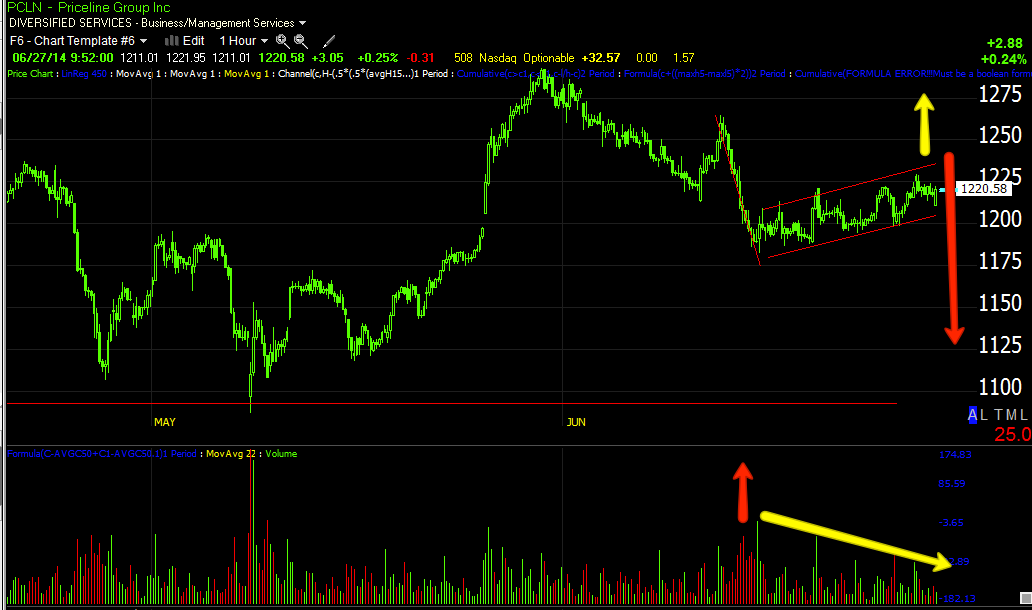
I know this is sloppy and hard to read, it's a custom indicator I throw together that cumulates olume so you can more easily see the volume trends at the price trends.
It's exceptionally important to verify a H&S top with volume analysis, the entire price pattern is formed because of psychology and volume is a big part of the psychology.
We should see falling volume on the rallies in the H&S top and rising volume on the declines, just follow the white line and price, I added red arrows to show falling volume on rallies and used yellow arrows for rising volume on declines. The left side of the pattern isn't as important, but by the time you reach the decline from the head (right side of the head), volume becomes increasingly more important to confirming the price pattern,
note volume to the far right on this last little bump up, also a bear flag like the market.
This is the daily 3C chart showing the correct underlying trade/distribution that increases as we move further to the right of the pattern.
For a longer term view, here's a 4-day 3C chart.
At 2009,
1 we have strong confirmation and a leading divergence, the gain for the year was 192%. At
2 we see some light 3C weakness during 2010, the gain for the year was 81%. At
3 we see a relative (weaker form) negative divegrence and price starts to stagnate, the gain for 2011 was only 14% and the gain for 2012 was 28%.
At
4 we see a change in character in the Rate of change in price, remember the concept that changes in character lead to changes in trends, at the same time we start to see a leading negative divegrence.
Think about what smart money with multi-billion dollar positions needs to exit those positions without flooding the market with supply and crashing price and thus their portfolios...they need demand and what better way to get it than to create a strong momentum push that retail will follow and buy whatever they can. The gain for 2013 was 79%, a huge change in character from 14 and 28% the two preceding years.
And as we reach the leading negative divegrence at 5, which is where the H&S top is, the gain for the year for 2014 thus far is 6.79%, as I said, the change in character/ROC of price in 2013 led to a major change in trend at 2014, the lowest return thus far by a wide margin.
This is the 4 hour chart, 3C is acting as it should, much like volume acts during a H&S top. To the far right at the yellow arrow is a small bear flag similar to what we see in the market right now.
The hourly chart is showing confirmation right up to the H&S top, then a leading negative divegrence of large size.
The 15 min chart at the top of the right shoulder and the small accumulation that created the rally right now that is a bear flag. I don't see a strong negative divegrence in the flag on this chart yet which is something I might want to wait for, depending on how I trade, how much patience I have, how much risk tolerance I have.
One compromise is to phase in to the position in 3rds or half size positions, adding the last part of the position as we have either higher prices with very good signals throughout all timeframes or simply very good signals throughout all timeframes.
When a market falls, it typically doesn't give much warning and judging by everything I've seen, especially since the last F_O_M_C last week, this market feels very dangerous, thus I increased my short coverage yesterday with SRTY (long).
The 5 min chart is smaller underlying flows, it shows the accumulation that started the flag with much more detail, it also shows a current negative divegrence building, I'll be looking for this to intensify and hopefully migrate out to the 15 min chart.
The 3 min chart shows even more detail and the negative divergence on the 5 min chart above over the last 3+ days is seen very clear here as it has migrated to the 5 min chart, suggesting it is gaining strength,
However, this is still a bear flag, a very common technical price pattern that is expected to break to the downside first which is why we see them head faked with upside breakouts more often than not as Technical Analysis teaches, "If a price pattern doesn't move as it should, it's a failed pattern and you should reverse your position".
In the Wall St. world of misdirection, that would mean any bearish PCLN traders looking at the bear flag and then seeing a head fake breakout to the upside, would or "should" according to technical analysis, go long, this creates a bull trap and when prices resume down and come to the flag area where the long positions will likely have their stops, the move below sets off a cascade of stops being hit, adding supply to the market and driving prices lower. This is one of the main functions of a head fake move, to generate momentum without actually investing any money in to it.
Looking at the daily chart/big picture, this bear flag is almost a matter of semantics, I'd much rather not miss the move waiting for a head fake of a couple of percent, but at the same time we always want to get the best positioning, the lowest risk and this is a concept we are well acquainted with, making it a probability.
I'll be setting some alerts for price action both above the upper resistance trendline of the flag as that would be the best entry or add-to area and a set of alerts below the support of the bear flag in case it just breaks, I'd rather be in below the flag, but above the H&S neckline that not be in at all. If you are interested in the trade set up, I'd suggest setting some similar alerts.


No comments:
Post a Comment