The UNG Aug. 22 calls added on Monday, July 14,
Trade Idea (Short Term/Options) UNG Call at a August (standard) expiration, $22 strike are down a little under -12% which sounds horrible if it were an equity position, but for an options position it's a drop in the bucket that can quickly turn in to a double digit gain in minutes.
I still like the UNG call position VERY much, I would consider a UNG long equity position or perhaps the leveraged long UGAZ.
Here are the most recent charts, developments and possible add-to areas or new position entry areas.
This is a longer term range, I drew it as a rectangle, but it's a bit more like a large triangle, either way, as we say in the south, "Same difference".
The yellow rounding area is a typical reversal process that I always look for as "V" shaped reversals are very rare, this has a lot to do with the size of institutional positions and the time it takes them to set-up their position as well as the cycle that is really under their control.
I've actually been watching UNG for this break down and like a H&S top that just breaks below the neckline, it is not uncommon for new shorts who entered on the break of the range to be shaken out in a reversal to the upside which mist move above the range's bottom trendline support as that's where you'll find the new short sellers' stops and that's the ultimate goal, to kick them out of the trade.
Here's a closer look on a 60 min chart, even the downside reversal has a process, although top reversals are often much broader than upside reversals, I don't know why, I've just noticed it over and over again.
Interestingly, yesterday looks like a head fake stop run was carried out, volume spiked just as support was breached, this is often a good timing marker for the start of a move as we see these head fakes (this one a stop run) 80% of the time before a reversal and this works on any timeframe from weekly charts to intraday charts (like the IWM move I'm watching for intraday today).
To give a brief overview, the 60 min chart where the strongest underlying flow of funds is found (other than longer timeframes like 2 & 4 hour or daily/weekly charts) shows distribution at a recent reaction high and that's where we saw the move below support take hold as well as a positive divegrence which is much smaller in scope, meaning I expect a shakeout bounce, not an upside breakout of the range.
I love these charts like 10 min as they show perfect confirmation as 3C makes lower lows with price, there are small divergences you can see in the trend, but the main theme is confirmation of the downtrend turning in to accumulation. I find these charts to be very reliable.
The 3 min chart is going to have a stronger looking divergence, but in actuality the weaker looking 60 min chart's positive divergence is much stronger as the timeframe is indicative of much larger underlying funds moving around.
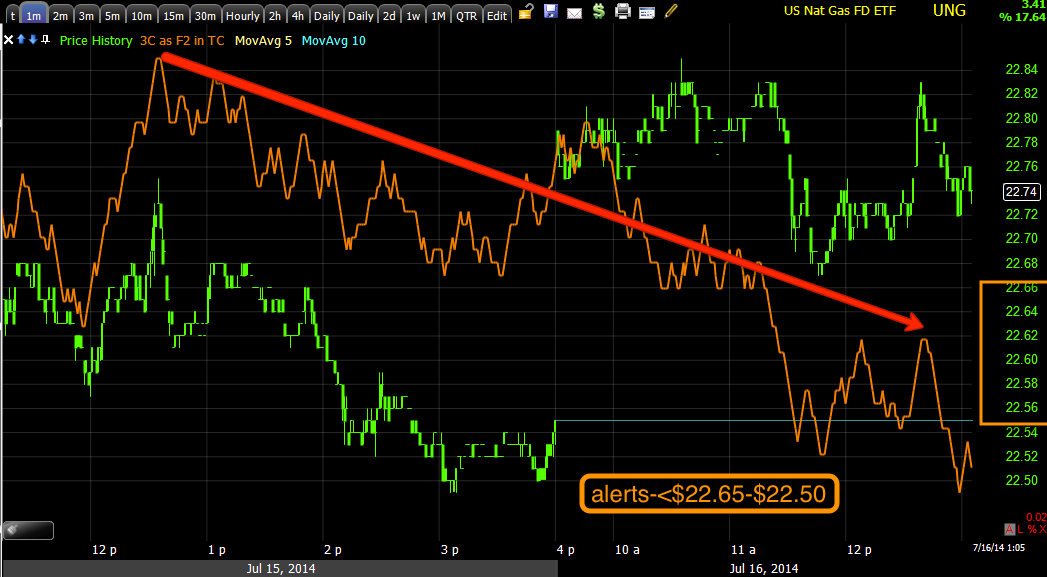
Intraday on the 1 min, we saw a gap up today right after yesterday's stop run, however there's a light negative divegrence. I'm not moving the UNG calls in place,
but if this negative intraday leads to a gap fill before continuing higher, I would consider this an add-to area or area for new long positions in UNG or UGAZ so if you are interested, I would set price alerts from below $22.65 to below $22.50. If the alerts are triggered, I'll double check a pullback in to the gap for accumulation, if it is there as I suspect it would be, I'll let you know as this would make for a nice add-to or new entry.


No comments:
Post a Comment