Yesterday a 1/2 size equity short position was opened in "Z", if you recall, the only thing I didn't like about "Z" is its lack of a reversal process, although parabolic type price moves like Z's often have much tighter turning radius' at tops, today I'm happy to see it is adding to the reversal process and if it continues to do so for another day or two and I see a high probability/low risk opening, I will fill out the position, especially in light of the market's overall tone with a fairly obvious (but very weak) Dow 17k print going in to a 3-day weekend.
The charts are really all that interest me.
This is a 1 min (small) intraday divegrence started about the same time as the broad market/IWM yesterday which was a pretty impressive forecast for this morning/today. The chop in a lateral area is what widens out the reversal process as you'll see on a longer term chart.
The 2 min chart shows some of the same positive divgerences, but these are exceptionally small, not the stuff of a pullback getting ready for the next leg higher.
In fact,
At the 3 min chart, there's no migration of the divergence at all and it remains in a worsening leading negative divegrence, remember the reversal process is so larger funds can move their positions, it takes them more time than our single orders as they can be $1 billion dollars on average.
This is why the reversal process is so important to me, look at enough stock charts on these timeframe sand you'll see a "V" shaped reversal is VERY rare and usually only driven by unforeseen news or fundamental events that market can't discount. Otherwise, you'll see that what looks like a tight reversal on a daily chart is actually a larger process of a rounding over on intraday charts.
This lifts my hopes for Z and makes the trade a lot more appealing as this was the single issue I had concern about and the reason it was opened as a half size position, which may change quickly.
The process on a daily chart in to its 4th day, still very narrow , but Z had a very parabolic move and they tend to be more narrow.
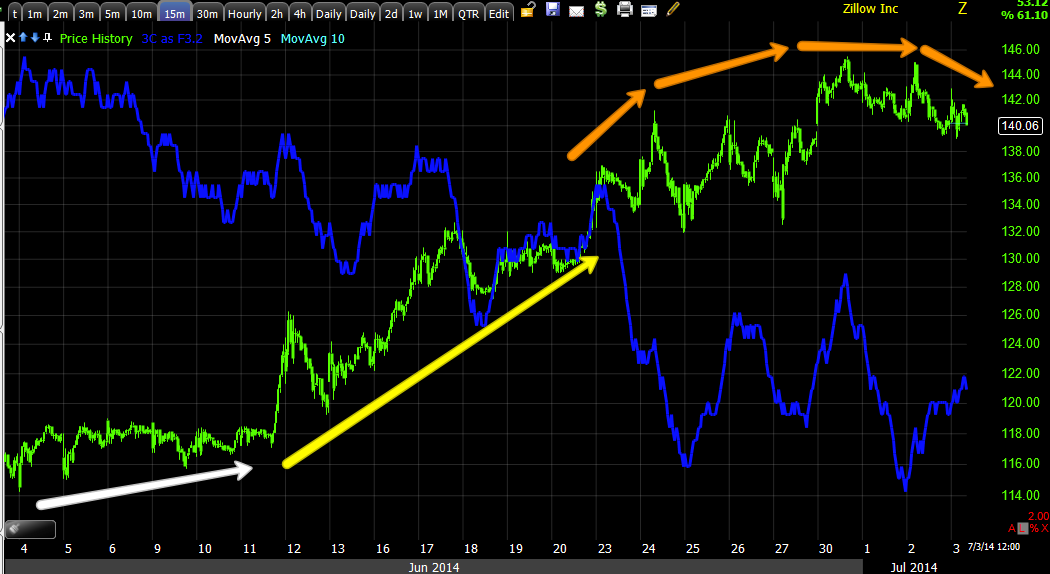
On a 15 min chart the increased ROC on the upside before we hit a topping area and the reversal process playing out, you can almost forecast how large it will be from what's there already, I'd guess a day or two more unless there;s a very defined resistance area, then a head fake move before the reversal takes hold becomes higher probability, but given the mood of the market (SKEW) I have a feeling there are going to be a lot more reversals skipping the extra bucks of a head fake move as they won't need the head fake move's momentum as the market will provide that.


 | Theme by Thur
No comments:
Post a Comment