I think the post from Monday about patience may have been the right post at the right time.
We just came out of the best looking base since July 1st, the two previous bounce attempts since July 1st have shown a huge change in character which leads to changes in trend. Specifically bounces use to move up for several days before distribution would start, the previous two bounce attempts saw immediate distribution the first day, the first hour of their bounces.
I suspected because of the size of the base and the decent divegrence on 10/15 min and even a 60 min chart, that this bounce "may" be different, but I was definitely very interested to see.
While it's way too early to say definitively, there's certainly some price/underlying trade action that suggests , "Maybe this is no different than the last two bounce attempts". Maybe Wall St. isn't using bounces for the same reason they did prior to July 1st which was usually to set up some head fake / bull trap. Perhaps they are doing the same thing as the last two attempts and selling any and all price strength in which case there's very little reason for me to consider a bounce long, but rather focus on position shorts.
In any case I'm going to be putting together a post that is going to take me a little bit of time, it's an asset that I think may be one of the few longer term long positions that may hold up in a bear market decline so before I do that I wanted to get an update out.
Because it take so long to capture and post these charts, some of the faster 1 min charts may look a little different now, in that case I'll try to give you the closest update verbally if there's a difference.
NASDAQ 100 Futures / NQ 1 min intraday gone negative, they still are, but not tracking lower, but to the side.
ES/SPX Futures intraday have gone leading negative as well, also tracking a bit more laterally and slightly with price, but overall in a negative position.
SPY 1 min leading negative has a slight improvement from this leading negative divegrence which seems to have hung up price in the area, still leading negative
SPY 3 min chart is in line, this was the migration and the charts looking better and closer to the 5 min chart at which time a long trade is safer.
The SPY 5 min chart shows the fix it needs to be in line or positive, rather it continues to show what looks like the same type of selling at any price strength as we saw during the last 2 bounces.
This is the 10 min SPY base/positive divegrence which should support a strong bounce, I haven't given up on the idea, but today's action seems to look a lot like the last two bounces that didn't get far as every bit of price strength was sold in to.
QQQ 1 min looks pretty much the same.
It's the 3 min chart showing distribution in to today's move.
It seems to me that the intraday 1 min steering charts are being held in place (like a market maker/specialist working the bid/ask to keep price from collapsing while selling in to the price strength.

This 5 min QQQ leading negative today surprised me, this is still in place and just tends to back up what was said above.
A closer look at the 5 min chart today which "should" be in line with price this early in a move out of the base area.
QQQ 10 min base -
Now I'll have to be paying extra close attention to see if there's any deterioration here, if so, I'd be focussing on position shorts sooner than later.
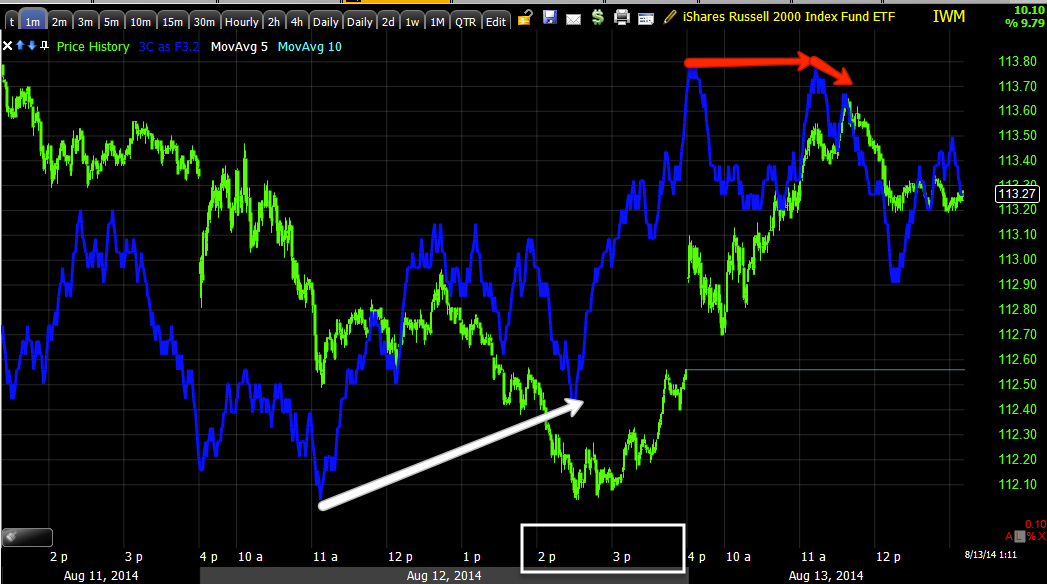
IWM intraday saw a positive yesterday gapping it up and in to higher prices it has stalled.
There's some improvement on this 2 min chart, again as if there's something like a market maker/specialist working the bid / ask to maintain prices near a sell level like VWAP which we will see as well.
The IWM's base which is a very sturdy base, I'm still on the fence as to whether this can move like it should or if its fate will be the same as the last two bounces which would indicate a greater urgency on the part of sellers rather than waiting for higher prices, they just want out.
TICK has lost any sense of trend intraday which is in line with price action.
My custom TICK showing buying late yesterday and selling in to today's highs.
What I'm still looking at is whether there's an attempt to repair or get the 3 and 5 min charts in line for a strong move worth trading long or whether this is the same story as the past 2 bounce attempts.
Looking at the base area, you can see TICK improving in to this week's initial move higher, but it seems to be deteriorating in to today.
And the top channel of ES's daily VWAP which would be the ideal area to sell/fill orders.
More as it becomes available, but I think "patience" was and is a good idea, there's just not a strong trade on the table here worth the risk.


No comments:
Post a Comment