Yesterday I posted, Trade Idea (Swing) NUGT Long in which I thought GLD was also a bounce candidate, but didn't like the leveraged GLD ETFs vs GDX's. Then I posted the charts right after in GDX , NUGT & GLD Charts which went in to more detail,
"For now this is a trading position as there are still longer term divergences that still suggest a pullback in GDX and if there's a break below recent support that ends up being a head fake move, I'll have some room to add to the position"
Today's move in both GDX and GLD looks like a head fake move below recent/local support areas, again there are very fast divergences that have migrated to longer charts through today alone. The charts I'm posting below are especially meaningful when looking at today's action.
GLD intraday with that typical rounding reversal process from today's gap down with a building leading positive divegrence.
That divergence was strong enough to migrate to the next longest chart at 2 min also leading positive
The 5 min intraday divergences I take very seriously as they tend to be the first or fastest timeframe where we see the movement of institutional activity intraday and this is leading positive like a rocket.
This divegrence has moved all the way to the 15 min chart in a single day, it's not unheard of, but it's rare.
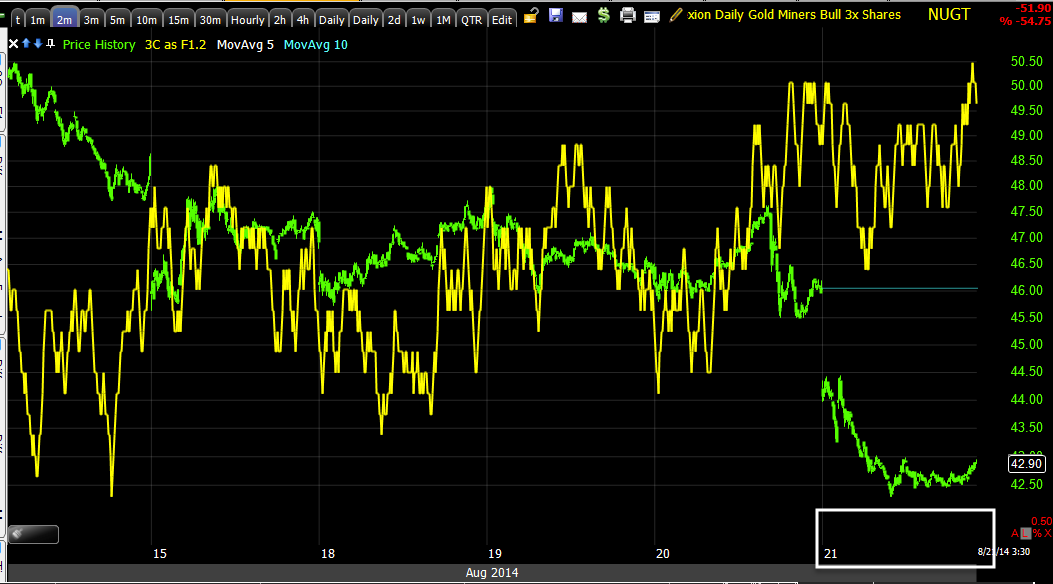
NUGT intraday 2 min shows similar activity as does GDX as well as GDX and GLD having a fairly tight correlation.
NUGT 3 min with that same near vertical intraday divergence
And all the way out to longer intermediate timeframes like this 10 min in a single day.
It appears something interesting is going on in the precious metals complex.
Is interest rates about to start going up?
-
Yes, I know - it does not make any sense - FED is about to cut
rates...but....real world interest rates are not always what FED wants it
to be.
6 years ago


No comments:
Post a Comment