Considering the DIA is about -1.3% off its recent highs, not a big move, but compared to the first and second quarter, a huge move as volatility was completely dead with +0.10% moves being celebrated back then as victories for the bulls. The SPY is about 1.85% off recent highs, the Q's about 1.39% and the IWM a leading -5+% off September highs, for the most part, it's easier to understand the breadth destruction off the July highs with the SPX down -4% and the Russell about -8%, however this time around, even last week as we made SPX and Dow all time new highs, breadth was deteriorating in to the move higher, the head fake area last week as compared to July and early August as the market was moving lower meaning right now there's a divergence in breadth, it is deteriorating at a more rapid pace even when the market is up.
As for the oversold P/V relationships, the S&P sectors all red two days in a row, 90+% of all of the Morningstar groups red two or more days in a row, we'd normally be well in to an oversold bounce, even on a 1-day basis.
This is hardly scientific, but it shows the clear changes in the market by S&P sector over different periods of time, the obvious take-away is massive deterioration...
The S&P sectors by percent change over each time period which are labelled above as 1 day, 5%(5-days), 10% (10-days) and so on, 21 days all the way out to 250 days. As you move from right to left (the most recent), you can see the building deterioration in multiple sectors, and this as the market was making new highs.
As for the intraday charts, it's a bit tough to collect and post them as they are pretty quick, but these still represent the themes that are still in play or current.
The DIA which I have been saying looks the worst has been confirming the move down until just recently on this 1 min chart, largely late yesterday and today.

The IWM is starting to show some more life in its divegrence, but it has been a sloppy affair as I see continued small and mid-cap destruction in the nightly breadth charts, this would usually create some bargain hunting or knife catching and a short term bounce, that's what we are looking for , both for our own purposes and to understand how dramatic the shift in character in the market has been as I am definitely seeing signs I last saw early 2009 or 2008 and it's remarkable to recall how bad things get in a bear market, but these breadth charts are already worse than the last bear market which should be terrifying for long, bulls, large institutional funds who have no one to sell to as the retail investor has been either exiting the market or has been tapped out on margin for quite a while. The closest circumstance I can compare it to is the AAPL decline from all time new highs in 2012 as hedge funds rushed to sell to a public that wasn't buying, AAPL's lost -45% in 8 months after years of being the market darling that could do no wrong.

The IWM 2 min chart, sloppy, but still positive.
The QQQ 1 min has been leading as it was yesterday
As is the QQQ 2 min
And even an accrual o these divergences on a 10 min chart.
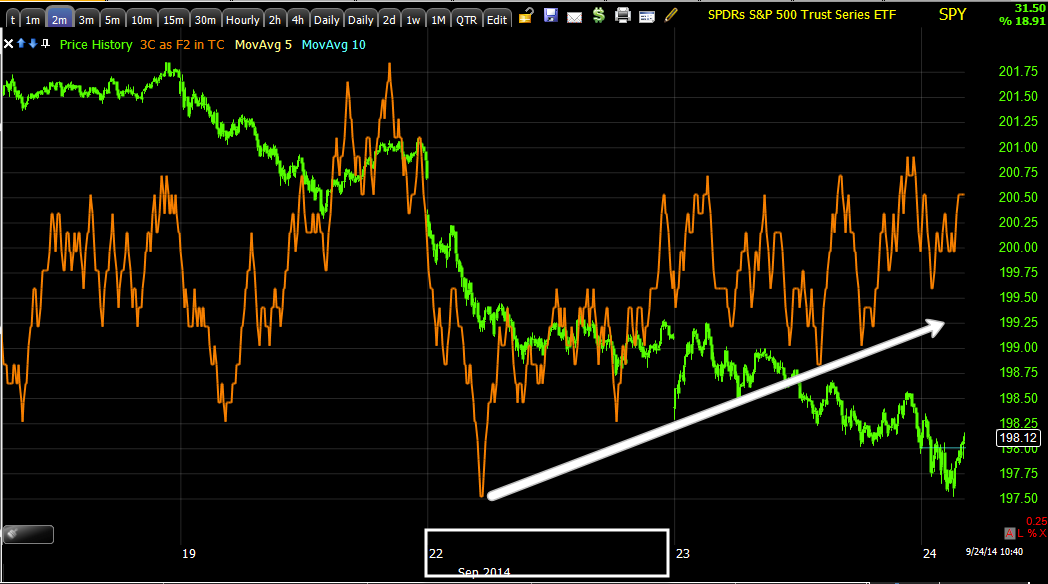
SPY 1 min is leading this morning...
The 2 min trend is in good shape and
the 3 min trend is in good shape.
Even the 5 min is in good shape.
I see no reason why these should not bounce or correct.
You have to pay attention, but the TICK has improved as well, most notably not making lower lows and of course the trend higher. Intraday tick...
has broken this morning slight weakness early on.
It appears that after the a.m. shenanigans have run their course, the market is looking a bit more serious about making this corrective bounce off Monday's accumulation, yesterday's head fake move that was confirmed late in the day and after running the usual stops and limits in the morning, it looks like this is one of the best chances for this market to get its act together, but don't expect it to hold long.
In addition, as the only liquidity game in town continues cutting liquidity, (The F_E_D), expect to see some wild volatility in the days, weeks and months ahead.


No comments:
Post a Comment