It seems excessively clear at this point with HYG making a 5-6 day positive divegrence, the idea was to make the August cycle's head fake move posted earlier today, yesterday/last night which looked like this in last night's Daily Wrap...
This is what the normal concept of a head fake move would look like before a downside reversal on top of a rounding top, all of this should be seen as a singular cycle off the early August lows and base from 8/1-8/8.
The reason for needing HYG? Exceptional breadth and internal weakness, underlying (3C) weakness, etc. The only real lever left as the carry trades have failed is HYG and it has not done so well for the market today as I currently don't see an average up more than a quarter of a percentage point on an upside head fake move or rather F_O_M_C knee jerk reaction.
As of this afternoon just after 1 p.m., the analysis was for such a move as posted in the previous update.
As for the initial charts I have during the post F_O_M_C and the press conference, there was a wait and see element, but tone quickly turned ugly, we'll find out how bad after the close with market internals, but during the event...
SPY intraday leading negative as the press conference came to an end.
The SPY 5 min chart which is essentially the roof on the upside move for this week as forecasted Friday in the
The Week Ahead post is now showing a clear negative divegrence. There's only so much gas in the tank for a move on the upside with about a day (Monday and early Tuesday) of accumulation which reached the 5 min charts. As the 5 min charts deteriorate and turn negative, we have the same pivot as the Monday/Tuesday divergence, except to the downside.
DIA 1 min intraday looking horrible.

The migration to longer charts, like the 3 min and...
The 5 min which was still in line this morning, now with a negative divegrence.
IWM took some of the worst of it with pretty sharp leading negative divergences, but it also had the most upside to sell in to.
Showing the IWM 3 min with this week's early positive divegrence forecasted on Friday and the migration of the 1, 2 min negative divergences to the 3 min chart.

This morning we had a small relative negative divegrence (the weakest form) on the IWM 5 min chart, you can see, since the F_O_M_C, that divegrence has grown and is in worse shape, now starting to lead negative (stronger divergence form).

The QQQ 2 min with the end of the positive divegrence in to Tuesday morning lows and a sharper negative divegrence in to the F_O_M_C.
There's clear migration from the QQQ 2 min chart to the 3 min chart, next stop the 5 min chart.
Thus far the 5 min is the only of the major averages still "in line", I suspect this changes soon, tomorrow.
As for breadth during today...
The hard number count of advancing stocks less declining stocks intraday was tame pre-F_O_M_C and then was in a +1000 to -1000 range with a few outliers, but after the press conference dropped notably with -1500 and -1600 tags.
The TICK/SPY custom indicator trend shows TICK/intraday breadth slowly declining earlier in the day to a F_O_M_C pop and continuing to decline to lows of the day in to the close.
Daily breadth charts after a update should be revealing.
The MSI (
Most Shorted Index) which saw a short squeeze in Russell 2000 names on the open continued to lead through the rest of the day saw a catch up after F_O_M_C and no longer had any edge for the market.
If you want to know what is moving the market, what the strongest correlation is, it's the same one that allowed us to forecast price movement in to the F_O_M_C this week, the same one that allowed us to call for an upside knee jerk reaction after the F_O_M_C and will likely be one of the key indications of near term market action, HYG...
HYG has maintained an in line divegrence through the day with a little weakness in to the close, we'll see if that continues to deteriorate.
My gut feeling is, "If HYG with a 6 day divergence can't lift the market to something better than a quarter percent knee jerk move (often 1-2% moves), they'll abandon HYG quickly and that may be what we are seeing in to the close.
As far as actual proof of this correlation...
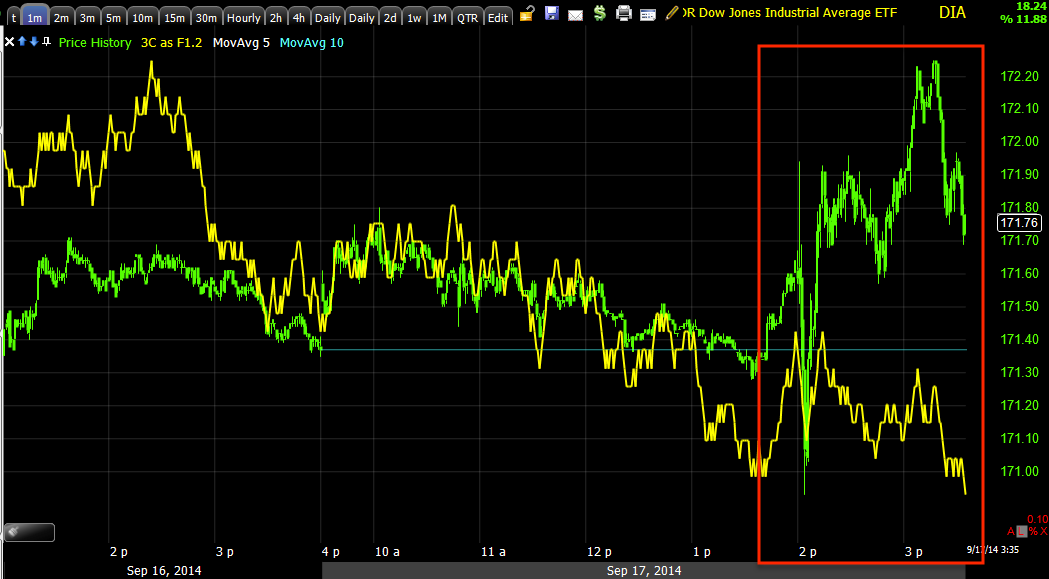
This is the SPY in green and HYG in red today, moving in tandem EXACTLY like yesterday, carry trades be damned.
More to come, I'm still picking through a lot of data.


No comments:
Post a Comment